
Crime Analysis with ArcGIS Pro Video Blog Series—Part 3
In the third episode of our Crime Analysis with ArcGIS Pro blog series, we will show you how to map and summarize crime data using polygons or lines and then calculate percent change in that data between two time periods. Counting and summarizing crime by police beats or districts and then visualizing change over time is a common workflow performed routinely by analysts to support crime reduction strategies and computer statistics (CompStat) or other accountability processes at many police agencies around the world.
To do this analysis, we will use a pair of tools in the Crime Analysis solution: Summarize Incident Count and Summarize Percent Change.
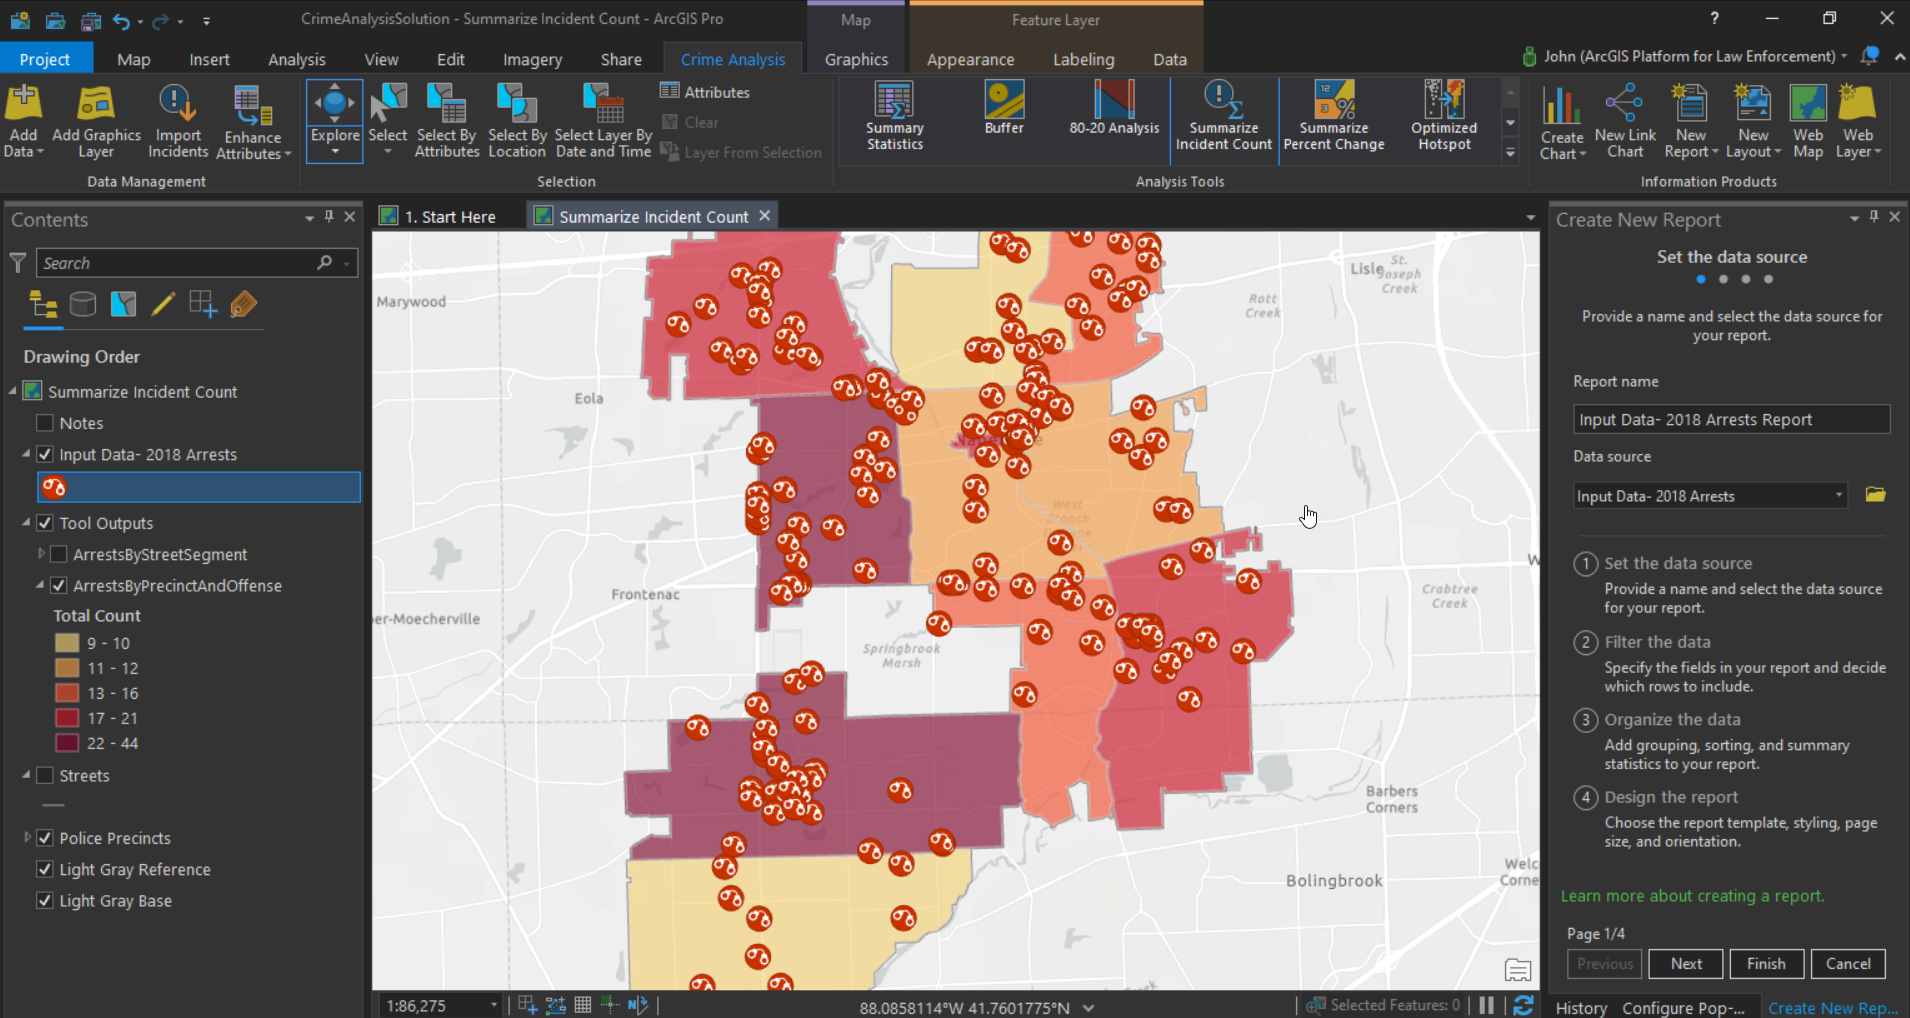
Summarize Incident Count
This tool generates an output layer of the number of incidents in a polygon and symbolizes the summary count using a graduated color map. The tool can also be used to summarize by street segment, a common analysis that is useful for assessing streets and other thoroughfares with high incidents of crime and disorder. These types of maps are useful for contrasting the comparative frequency of crime incidents across a jurisdiction and can be beneficial to police agencies for understanding trends and focusing resources on problem locales.
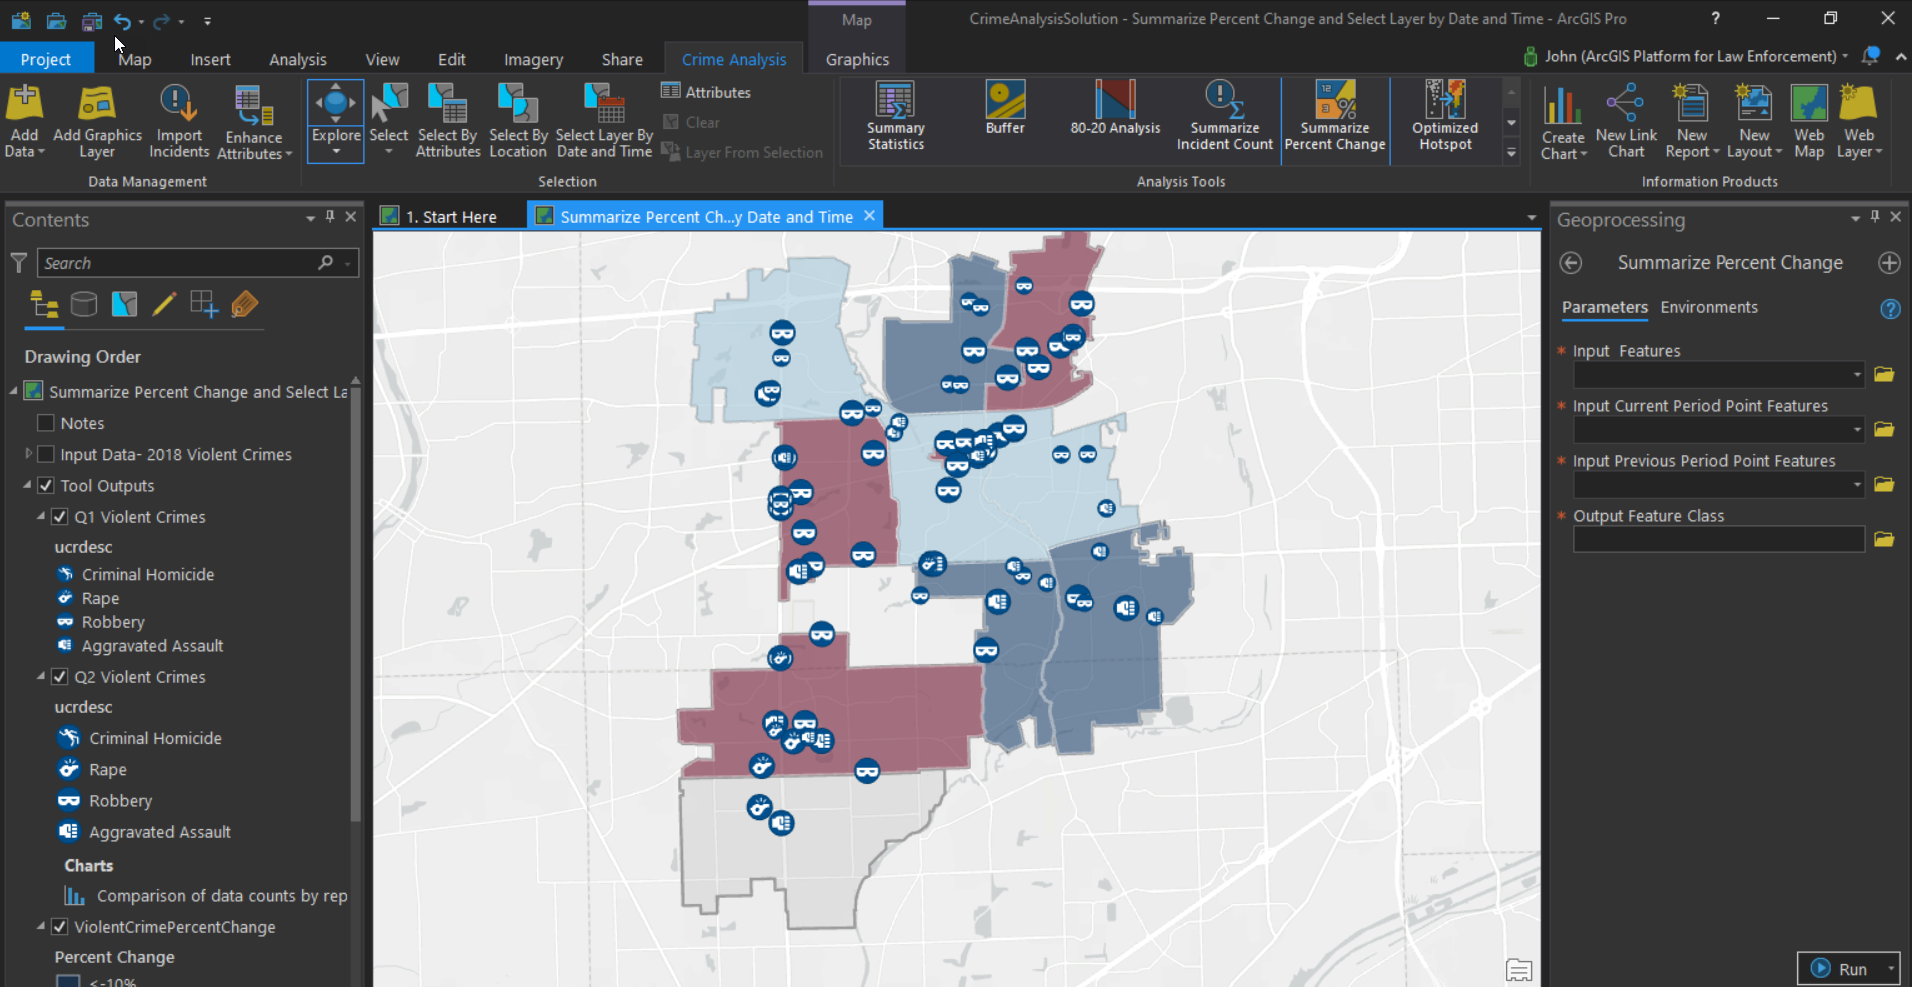
Summarize Percent Change
This tool can be used to compare incident counts between time periods and calculate the percent change for each. This type of comparative analysis is typically used to support and measure the effectiveness of policing strategies. Summarize Percent Changes is commonly used to compare the current period to previous periods and to compare month to month, 28-day reporting periods, current year to previous year, etc.
Now, let’s join Chris Delaney as he shows us how both tools work together to support your agency’s crime reduction efforts.
Additional Resources
Thanks for joining us for this installment in the Crime Analysis with ArcGIS Pro series. In our next blog, we will explore the repeat and near repeat analysis tools. Until then, you can learn more about the Crime Analysis solution by visiting the following links:
- Getting to Know the Crime Analysis Solution
- Introduction to Crime Analysis
- Getting Started with Crime Analysis
- Entire Video Playlist
If you have questions or feedback about this or any of the tools discussed in the upcoming blogs, you can connect with the following:
- John Beck, Director, Law Enforcement Solutions, jbeck@esri.com
- Chris Delaney, Product Owner, Law Enforcement Solutions, cdelaney@esri.com