In this edition of our Crime Analysis blog series, we will discuss hot spot analysis and methods of creating and comparing hot spots using ArcGIS Pro. Hot spot analysis is a standard practice used by many police agencies to identify clusters of incidents occurring in their jurisdictions. By identifying clusters (or hot spots) of activity, police are better able to focus enforcement strategies and tactics on these clusters and more effectively respond to problems. Hot spot policing is supported by decades of research and evidence that have shown that by focusing on hot spots, police can have a significant impact on crime and disorder in those areas.
In this blog, we will discuss three tools that you can use to support basic hot spot analysis:
- Kernel Density Tool
- Minus Tool
- Density-Based Clustering Tool
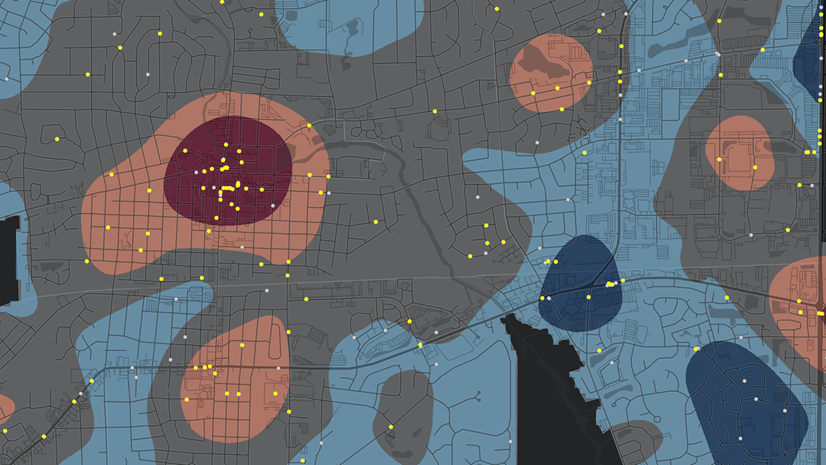
Kernel Density Tool
You are probably already familiar with Kernel Density Estimation (KDE). Crime analysts for decades have used it to help visualize the density of point features and is the go-to tool that many analysts still use when creating hot spot maps for their agencies. When the Kernel Density tool is run, it creates a single smooth density raster surface layer over the input points. The output of the density will change based on the parameters entered into the tool, including the search radius and cell size used.

Minus Tool
The Minus tool can be used to subtract one kernel density raster output from another to measure changes in density from one time period to the next. This tool can be useful in comparing reporting periods such as comparing this month’s output to last month’s output or to help understand the dynamics at work in a jurisdiction by looking at daytime vs. nighttime hot spots of activity.

Density-Based Clustering Tool
Finally, we will look at the Density-Based Clustering tool that uses machine learning to create an output layer of incidents comprising a cluster. Clustering is a type of machine learning and exploratory data analysis technique that when run on a set of data points, such as crime data, creates an output of clusters where the density of similar incident points is high. Unlike KDE, the output of this tool is not a raster but a group of unique and like-colored points for each discrete cluster in the data.

All three hot spot tools can be used together to give your agency a basic understanding of where clusters of incidents are occurring; to compare changes in hot spot activity; and, in the case of the Density-Based Clustering tool, as an alternative analysis to validate or complement kernel density output results. In this accompanying video, Chris Delaney details how each tool works.
Additional Resources
Thanks for joining us for this installment in the Crime Analysis blog series. To learn more about crime analysis theory and the practical application of geographic information system (GIS) technology and the mapping of crime, we recommend these books from Esri Press:

To learn more about the Crime Analysis solution, go to the following resources:
- Getting to Know the Crime Analysis Solution
- Crime Analysis Solution
- Getting Started with Crime Analysis
- Watch the entire Video Playlist
For additional law enforcement resources visit our website.
If you have questions or feedback about this or any of the tools in the upcoming blogs, you can connect with us:
- John Beck, Director, Law Enforcement Solutions, jbeck@esri.com
- Chris Delaney, Product Owner, Law Enforcement Solutions, cdelaney@esri.com