For over a year, we’ve been talking about how planning and housing professionals have been challenged like never before with the COVID-19 pandemic. Vaccination rates are rising, and infection and hospitalization rates are falling. Regardless, the current housing situation in the United States has been incredibly impacted by the pandemic and is a daunting issue for planners to overcome. The metrics indicate it’s not going to change any time soon. Let’s look at some key stats:
- Housing starts were down 13.4% in April. Making this worse is that 15% of builders say they are only putting down the slab (which counts as a start) and waiting on framing the house. (Source: U.S. Census Bureau)
- New building permits are only up 0.3%. (Source: U.S. Census Bureau)
- Prices for new and existing homes are at record levels due to rising material costs, slowing production, and labor shortages (Source: NAHB)
Nicole Friedman, Housing Reporter for the Wall Street Journal, stated in a May 21 interview that this growth is widespread with double-digit price gains in nearly every metro area in the country. It’s affecting big and small towns alike.
Planners in suburban communities that weren’t anticipating this level of growth, planners in rural communities seeing higher demands for land, and planners in urban areas facing combination of rising rents and vacant offices and apartments are all dealing with imposing housing challenges. For all the factors listed above, the key for planners in establishing a sustainable housing strategy is centered around location. Where is the demand for housing and why? Where are the parks, jobs, transit stops, schools, etc.? Where can increased housing make the biggest impact for residents? What and where are the affordable housing options, particularly for disadvantaged residents?
Today’s web-based GIS provides the tools that elected officials need to validate policy and the tools planners need to play out different planning scenarios and to measure and compare the metrics of those plans. For instance, if the focus is on mixed use, walkable developments, what is the target for the number of new residents, new jobs, and so forth? Is there proximity to transit, jobs, groceries, and schools?
Scenario Planning in the Aloha State
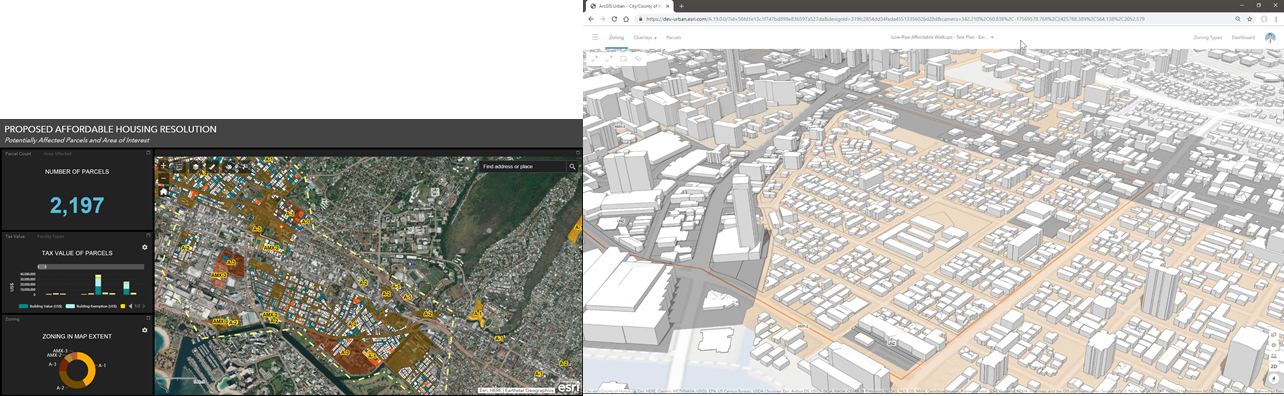
In Honolulu, Hawaii, short-term vacation rentals have made affordable housing scarce for local citizens. The state studied the housing demand and predicted that Honolulu will need nearly 26,000 housing units by 2025. To gain an understanding on these changes and how they impact citizens, city analysts and planners used existing data available through the City and County of Honolulu’s Land Information System. They mapped the problem and suggested solutions such as considering changing zoning codes to address housing affordability.
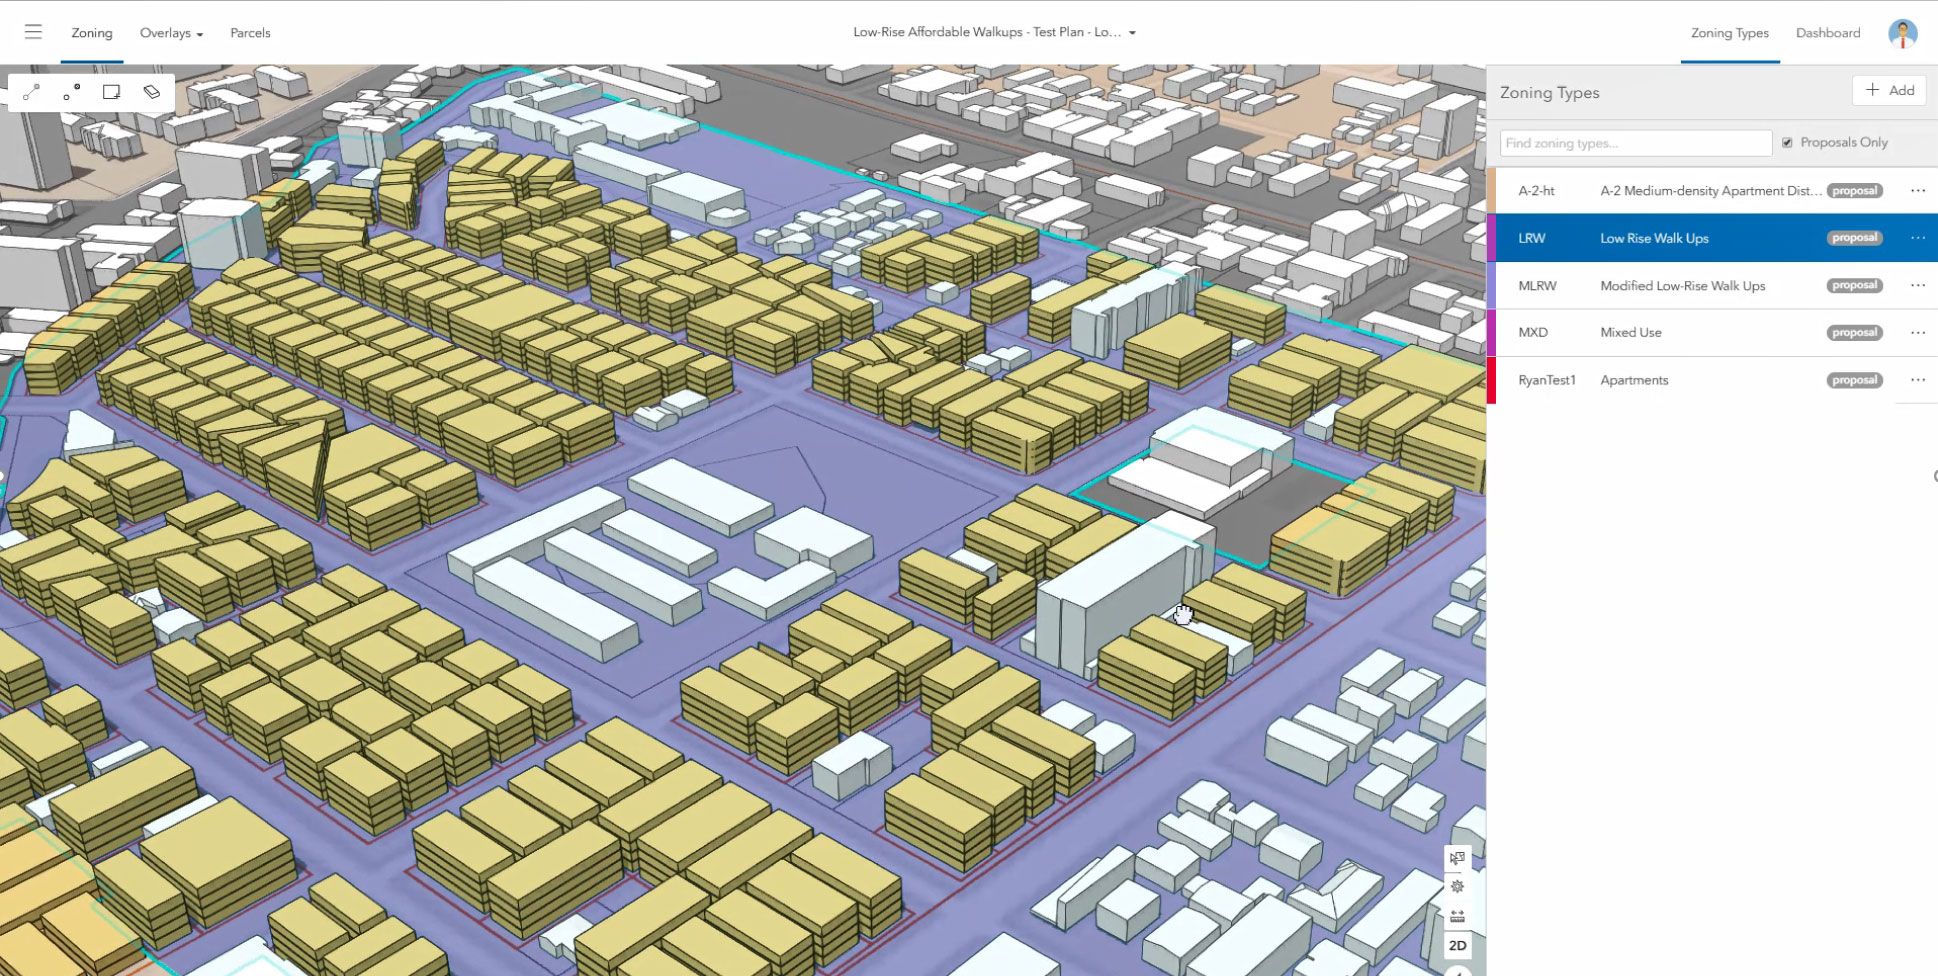
The Honolulu Department of Planning and Permitting employed ArcGIS Urban to analyze a zoning proposal that would raise low-rise apartment height limits from 3 to 5 stories. Using planning and 3D visualization tools, staff entered various zoning code values and instantly saw the impact different height levels had on housing availability. In one neighborhood, increasing apartment building heights increased housing from 60 units to 227 units, which was below the department’s 325 target. In a second scenario, planners completely reconfigured the apartment structures in the same neighborhood thereby increasing housing availability to 363 units.
Stories like Honolulu’s will become more and more common as the housing situation in the U.S. plays out. Planners need to embrace this data-driven approach so ensure the development plans for their communities are sustainable in both the short and long term and that they equitably meet the growing needs of all it residents.