By Ryan N. Christensen, GIS/AutoCAD Manager and Alicia Keeter, General Manager, South Walton Utility
At the Water Environment Federation Technical Exhibition and Conference (WEFTEC), South Walton Utility Company, Inc. (SWUCI) water/wastewater director Joe Ream spoke to Esri personnel about asset management. During the conversation, Ream spoke on how SWUCI is using Esri geographic information system (GIS) technology. He shared how I have been setting up and utilizing as much of the software as possible for the betterment of our utility. ArcGIS Survey123, ArcGIS Collector, and ArcGIS Online, to name a few, are some of the applications in GIS that we have been utilizing to delay buying an in-depth asset management system. A few weeks later, Esri asked if we would be interested in sharing the success South Walton Utility Company, Inc., has had using ArcGIS. I looked at previously written works and videos, and they seemed to focus on two areas: using the software from Esri to move away from paper maps in the field and how large utility companies with larger budgets bought solutions to automate everything and gather data. That’s when I stopped.
I had an aha moment. It’s not about the hardware or even the different licensing agreements needed. It is about gathering asset information and sharing it with the individuals who will benefit by having this information. In addition, seeing the location of the asset on a map tied to the data is very valuable. There is a tremendous amount of data one can add to a feature if the attribute table is set up properly.
Keeping up with Demand
A little history: SWUCI is a medium-sized potable water and wastewater utility company located in the Panhandle of Florida, specifically Miramar Beach, which is nestled between Destin and Santa Rosa Beach. The SWUCI franchise area is set up as follows: we operate and maintain 13 potable water wells (7 along the coast and 6 located approximately 30 miles north of the coast), four ground storage facilities, and four elevated water towers. Staff operates and maintains one wastewater treatment plant, 47 lift stations, reuse lines, and gravity mains. We serve more than 10,800 potable water members and 5,283 wastewater members and wholesales potable water to Destin Water Users. SWUCI is in what is considered a prime vacation resort area. The population will almost double in the spring and summer months compared to our winter snowbird months.
When COVID-19 reared its ugly head, everyone—not just those from Florida—came to the beach. They worked from their laptops and phones, and when COVID-19 lessened, the people stayed. To accommodate the influx of the new population, developers began constructing new subdivisions, townhomes, and apartment complexes, while other developers began buying older homes near the beach and replacing them with huge resort homes. These homes consist of 10 or more bedrooms and an equal number of bathrooms and range from three to four stories in height. The new developments have challenged how we need to update our system to meet fire flow demands and larger demands for water in the peak tourist season.
With respect to our history, our operations began in 1969 with 100 members, and our infrastructure was built to handle the simple beach community life. As the land use changed, so did the need for our infrastructure to keep up with demand. For the past few years SWUCI has been reinvesting capital funds to improve older neighborhoods, and this has expanded our need for mapping and data management. Our utility consists of 40 employees and four departments, and we operate as a private, not-for-profit, board-operated utility. We are small in number and require each employee to engage in asset mapping and data collection.
With all the developments and redevelopment, SWUCI has been doing a lot more with the licensing we have, consisting of one ArcMap/ArcGIS Pro Basic and one Standard license. We began the journey 11 years ago in the digital mapping world. Utility line spotters collecting the location of our assets joined me in drafting and digitizing every paper copy engineering plan of our system maps that we could find. Once the map had sufficient information, ArcPad templates were created for our Trimble units as well as ArcReader maps for laptops. This gave the field crews visual representation of on-site assets and Trimble units for location accuracy. The paper maps are scanned and accessible to the field crews. The field crews use this information to find and isolate valves for leak detecting and locating meters and mains.
The Geodatabase
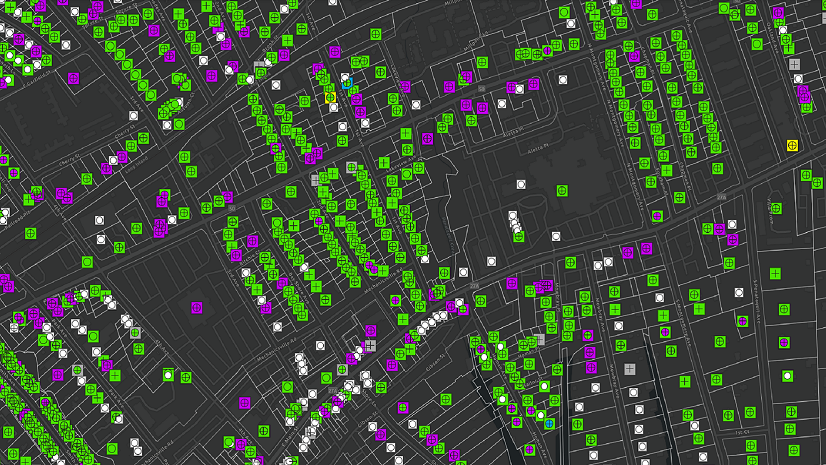
Along with digital mapping, I started learning about geodatabases, and the fact that all assets are connected to one another. Real-world scenarios can be analyzed using GIS data. I began using the Local Government Information Model from Esri, loading everything into several different feature classes. I quickly came to the realization that my current databases were not all connected as recommended. The services were not connected to the meters, so the challenge was to let the program connect pipes to meters or do it individually. I chose to do a combination of the two. The connectivity worked, and I was able to trace lines, meters, and values.
Now that I had a functioning geodatabase, it was time to use all that data to develop a working water model of the system. Working with the general manager and a third-party water model program, we developed SWUCI’s very first functioning water model. This could not have been possible without using Esri’s ArcGIS Desktop.

Joining the Cloud
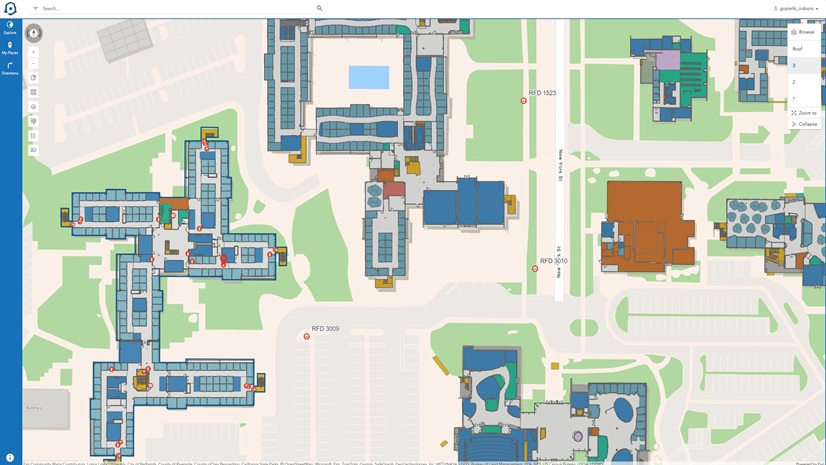
Around 2016, SWUCI began using ArcGIS Online. At this point, the field crews and managers could find assets using location services and collect location points on new assets as needed. This was completely out of the box, with a little trial and error, which we are still using to fine-tune the maps and dashboards. As an example of this process and its usefulness, one day the general manager was at our remote well field and could not find a monitoring well. He called, and I uploaded the point to an online map, allowing him to drive right to the location. To give an idea of the area, the well field is approximately 15,000 acres of land located outside of our wells and storage tank areas. With this application, the general manager was able to gather the information needed to solve a problem in real time, where before he would have spent half a day traveling back to locate this well on a paper map.
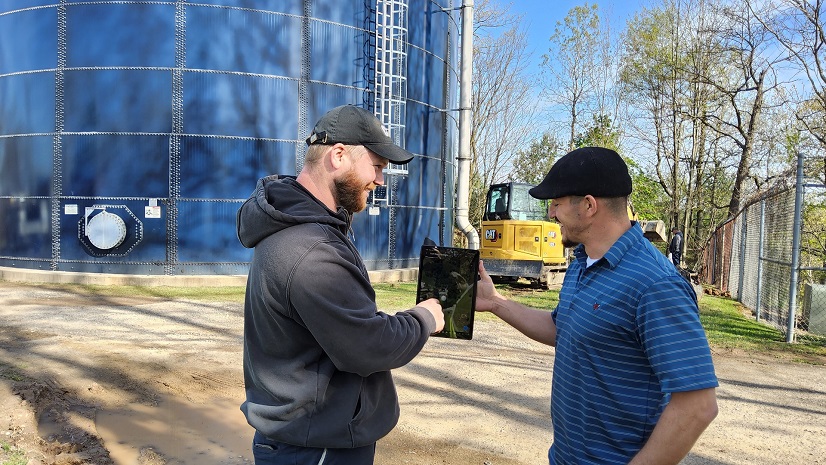
The Trimble units that we use to collect location data are old, and we discovered that Trimble does not make them anymore. We researched what is currently being used and met with Trimble representatives about different options. Our workflow for gathering data seemed to be very antiquated. We gather data, download the data from the Trimble unit, and merge the data with our existing data. We have used Esri’s ArcGIS Collector app to collect points, and now there is ArcGIS Field Maps. Knowing this, we decided to purchase a Trimble DA2 unit and use the new Catalyst subscription to collect data. As an example for the DA2 unit, we received plans from our local county public works department on stormwater modifications. We used the unit to collect the horizontal location of our pipes and compared it to the survey data given by the consulting engineers, and we were able to rectify conflict areas with drainage inlets. This has been a game changer for our utility. The workflow to upload and download data has gone from hours to minutes. Also, being able to view the data as it is being collected has made the managers in the other departments excited to see work happening in real time.
Our GIS programhas become another tool in our toolbox. It is just as useful and important as a shovel or a pipe wrench in our industry.

The Application
When Esri came out with ArcGIS Survey123, I immediately started learning how to create forms. We have a few programs that require form-based data, and this was a perfect opportunity to put Survey123 to the test. The SWUCI Fats, Oil and Grease (FOG) program is one of these, and it allows the inspector to sign and print for the members/customers’ files. This allows the inspector to move on to another project. One form that we are especially proud of is the lift station inspection form. It allows the wastewater field crews to input and calculate the gallons per day and the total dynamic head electronically. To check and evaluate sanitary sewer lift stations, we do a drawdown test. This test consists of calculating the amount of wastewater the station can pump within a minute. In the past, I would meet the wastewater team at the station and calculate the pumping capacity of the station and add it to a paper form. With Survey123, I developed a form that could calculate all the information once the static information was added. This system allows the information to be stored in an online map for managers to review as needed. When the field crew learned how to use the form, I was no longer needed in the field and was able to concentrate more on modeling efforts for the wastewater system and speed up the time needed for evaluation and redesign.
With Survey123 I can evaluate restaurants’ and hotels’ grease traps. I can then upload the information to our company server for management to see. In the survey you can see the name, address, and GIS location of [the] grease trap on the utility map. It will also include the size of tank or tanks, pipe diameter, and who services the grease trap. You will also find a picture of [the] grease trap at location, and more. This is a great tool for any FOG inspector to collect data and recall any data already taken.

As in every aspect of our operations, there is always changing information with field crews finding assets not previously shown and new developments being added. The information that SWUCI has mapped is ready to be shared with the people who need it, from engineering consultants requesting the nearest potable water or wastewater locations to county government officials needing information for drainage and roadway projects. Having asset information easily available in GIS and apps helps SWUCI minimize impacts to SWUCI assets so our members will not feel the impacts of changes in their rates.
GIS is a great tool used frequently by our staff to locate meters and sewer services for members, hydrants for construction water, and backflows for inspections. This saves time and work by eliminating the need to generate work orders and send technicians to the field.
GIS is the hub that connects us. The data in our GIS is used within ArcGIS Online and in Esri applications, and it supports our hydraulic modeling software (WaterGems) and sewer management software (SewerGems). We are planning to implement an asset management solution in the future. The information in our GIS will make the implementation smoother and faster. GIS for water utilities connects crews with assets and assets with managers. Connectivity from top to bottom is the key to our success.
Esri and GIS-based systems have revolutionized the utilities industry in a way that can only be understood by the generations that didn’t have it. The ability to record, save, and document entire underground infrastructure with incredible accuracy is, simply put, the best tool and most innovative advancement that we have in the industry today.
Stay Connected with Esri’s Water Team
ArcGIS is an extensive information system that enables modernization of workflows with easy-to-use applications for the field and office. Strengthen your organization with smart water solutions that will increase efficiency and provide insight for decision-makers. Visit the Esri Water Utilities web site for more information.
Join the Water Utilities Community
Follow #EsriWater on social media: Twitter | LinkedIn
Subscribe to the Water Industry newsletter “Esri News for Water Utilities and Water Resources“
Learn more about how GIS supports digital transformation.