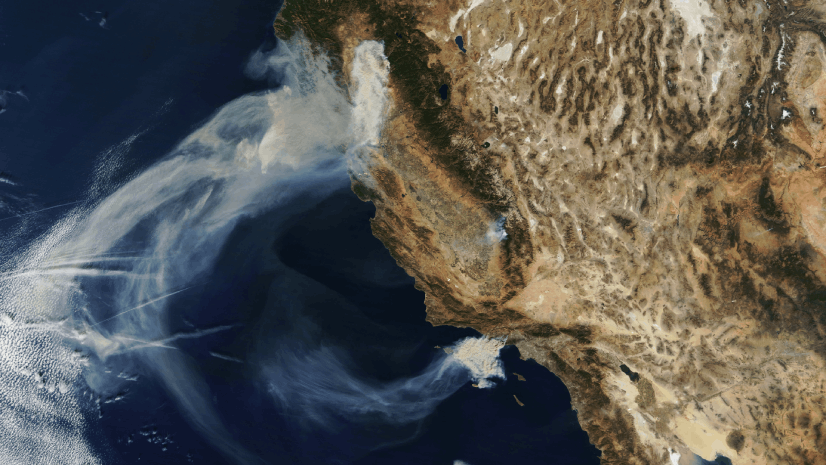
What Happens in the Arctic Does Not Stay in the Arctic.
While many people think of the Arctic as a distant ice land thousands of miles away, arctic infrastructure—such as permafrost, forests, glaciers, and peat—are critical to the viability of life on Earth. However, carbon emissions, urbanization, fires, pollution, rising sea levels, and human activity pose a serious threat to this essential ecosystem.
While there is a feeling of uncertainty, there is also hope. Hope begins in understanding our climate and the changes required at this pivotal evolutionary moment to keep it alive. We had the opportunity to connect with some of the research scientists at the Woodwell Climate Research Center who are devoted to understanding the trajectory of our planet. We discuss how they have utilized ArcGIS Hub to communicate Arctic science in a beautiful and effective way.

Would you please provide a brief overview of your background and how you came to work in the Arctic?
Erin: During my Bachelor of Science at the University of Waterloo, there were two experiences that led me to work in the Arctic. First, I did an honors thesis on lake sediment contaminant levels in a delta in Northern Alberta that really drew me into northern research. Second, I took an Arctic ecology course with a captivating professor who made me realize how unique the Arctic is, but that it is also rapidly changing from climate change. This inspired me to pursue a Master’s in Arctic Research at the University of Alberta, where I developed a research project and conducted fieldwork in the Northwest Territories. This experience provided relevant knowledge for my current position as a Research Assistant in the Arctic Program at the Woodwell Climate Research Center, and to continue assisting with research and communicating about the Arctic to broader audiences.
Greg: I’ve worked with hundreds of scientists over the last two decades plus, supporting their geospatial activities. The Arctic has always been the most interesting place to work. Over the years I’ve visited the Arctic many times, and I’m continuously inspired by the people, the complexity of the science, and the dedication of the folks working in the region. From a spatial perspective, the Arctic is far less understood because it has a fraction of the data that other terrestrial parts of our planet have, making it always a challenge.

What are the problems/challenges you are trying to solve?
Erin: There are many different types of challenges with Arctic research, but I can address one from the western science lens. One of the main problems that our team is trying to solve is developing a better understanding of carbon emissions from permafrost and conveying our findings to policymakers so that they can adequately incorporate these into carbon budgets and climate goals. The number of allowable emissions to reach temperature targets hasn’t yet included emissions from permafrost, which may hamper our ability to meet the goals outlined by the Paris Agreement. Beyond western science, there are other problems caused by climate change, colonization, and industrialization, but those are much more challenging to solve and would be better described from Indigenous perspectives or residents of the Arctic who directly experience these challenges.
Greg: Mirroring Erin’s comments about developing a better understanding of the Arctic, I have a keen interest in putting the results of our Arctic climate science on the map because I believe a cartographic approach is our best option for reaching a broad audience. The challenges we face when mapping our Arctic work are extensive. Some of them stem from the simple fact that the Arctic has far less (spatial) data than the rest of the planet, affecting everything from our spatial models to the mapped-based communication of our results. Additionally, from a practical standpoint, it often surprises me just how few people understand a map that uses a northern polar projection. Often, much more effort is needed to create an easily digestible map of the Arctic, by making better use of additional labeling, feature annotation, and so on.

Much more effort is needed to create an easily digestible map of the Arctic, by making better use of additional labeling, feature annotation, and so on.
Have you connected with indigenous communities that call the Arctic home? If so, can you describe your work with them?
Erin: In my previous experience in graduate school, I would spend a few months during the summer living in the town close to where we worked. This allowed me to present my research to community members, attend community events, and engage with the youth through educational activities or volunteering at the library. In my current role at Woodwell, I haven’t had the opportunity to spend much time in the field due to the pandemic, but other folks working on the project have been in touch with local community members to keep them informed about our work. One of my colleagues, Darcy Peter, also published this great resource with guidelines for working with Northern communities.

What are some common misconceptions when people think of the Arctic and how does Unstable Ground change that?
Erin: Before I started doing research in the Arctic, I assumed it was all snow and ice, with some polar bears wandering around the barren landscape. When I thought about Arctic field research, I pictured people wearing massive snowsuits and trudging through a blizzard. But spending a summer in the Northwest Territories, I was wearing T-shirts and sweating in the hot weather. There are towns and small cities up North where millions of people live. The ground is covered in diverse lichen, with wildflowers poking up on hillsides and streams cutting through mountain ranges. In UnstableGround, we try to include lots of pictures showing how diverse the landscapes are, and we especially like to use stories to take a deeper dive into the different components of the boreal and Arctic regions.

Greg: Did you know that more of the Arctic Ocean watershed is in Kazakhstan than Alaska? How about the simple fact that, however you map it, Russia occupies the vast majority of the Arctic and dwarfs all of the other Arctic nations (yes, even Canada). For years, whenever I mentioned to friends or family that I was going to the Arctic, they’d assume, or even say outright, ‘so you’re heading to Alaska?’. I think I had been to Alaska three times before I had even made it to the “Arctic” portion of the state, ha! I hope that our maps of the Arctic can help fellow mid-latitude folks understand that the Arctic is a vast and diverse region that spans a great number of ecosystems and political and cultural boundaries.
I hope that our maps of the Arctic can help fellow mid-latitude folks understand that the Arctic is a vast and diverse region that spans a great number of ecosystems and political and cultural boundaries.

How has GIS technology assisted you with this important work? What Esri-related products and/or solutions have you implemented?
Erin: The hub site has been a great way to share information, maps, and data in an accessible way with the public, policymakers, and people who might not otherwise know much about the Arctic. ArcGIS StoryMaps has also been a great tool to dive into a topic and really capture some of the stories of the Arctic.
Greg: Woodwell Climate is becoming a key provider of original spatial data related to Arctic system science. We use all aspects of geospatial technology to both create (and now distribute) our data. As our science progresses, we hope to make better use of interactive mapping applications to share the results of our work and then share the data via cloud-based archives (such as ArcGIS Online and ArcGIS Living Atlas of the World). As an analyst myself, I find it very helpful to have the ability to investigate a new dataset on the web before committing to integrating it into a model or mapping analysis. I think that a well-crafted mapping application allows potential data users to hit the ground running with our datasets.
Regarding Esri technology specifically, we have about 40 licensed users among our staff, a growing portion of which are Arctic researchers. They use a great variety of tools built by Esri, from analytical functions like hotspot analysis to ArcGIS StoryMaps app to plunging the depths of ArcGIS Pro Desktop software. But likely the most important part of Esri that we’ve made use of over the years is the kind Esri staff. They always seem to be there when we have dumb questions regarding maps, data, or anything geospatial – and they don’t hesitate to help.

Of the main topics listed in the UnstableGround (Permafrost, Carbon, Fire, Climate, and Ecosystems), is there an area you are more passionate about and why?
Erin: My master’s research was about organic matter released from thawing permafrost, so I have a bit of a bias towards the permafrost page. Learning more about permafrost and the geomorphic processes made me really appreciate the history of the landscapes and the implications on current conditions today. Most of the United States and Canada are postglacial landscapes, which we don’t typically think about since the major transformations happened thousands of years ago. But similar processes are happening now in the Arctic- permafrost has, in some cases, persevered for hundreds of thousands of years. Permafrost can span hundreds of kilometers beneath the surface, providing an archive of past climate and environmental conditions. The shape and direction of ice bubbles and ice lenses can inform the speed and way that it froze. Permafrost can form in either an upwards or downwards direction, depending on the presence or lack of glaciers, and incorporate dead animals, plants, peat, lake sediments, and more. Permafrost can also thaw and then re-freeze, which can change the chemical composition of the organic material that is stored, affecting how readily it can be decomposed when it is released. Warming temperatures can increase the rate of decomposition, so as micro-organisms break down this organic matter, they release carbon as a by-product in the form of greenhouse gases. This is important for the global climate because what happens in the Arctic doesn’t stay in the Arctic. Carbon that is released as greenhouse gases mixes with the global atmosphere and can further exacerbate climate change. I could go on and on, so I will stop myself there.

The number of allowable emissions to reach temperature targets hasn’t yet included emissions from permafrost, which may hamper our ability to meet the goals outlined by the Paris Agreement.
Greg: My favorite topic is without a doubt the stories. I’ve been listening to and experiencing the stories of Arctic friends and colleagues for a long time and I’m very happy that some of them can now be told- and often embellished with beautiful maps.

This hub site breaks down Arctic science in a way that all audiences can understand. Why do you think it’s important for scientist to communicate their work in varying formats?
Erin: The hub site has been a great way to combine many of these different elements, and I think ArcGIS StoryMaps is an awesome way to similarly combine photos, maps, and text into a more focused topic. We try to include photos, text, and numbers because people process information in different ways, so I think it is important to think about the different formats. The statistics and numbers can feel overwhelming and sometimes scary, but I think the photos are great to give people a more tangible sense of what the Arctic can really look like.
Greg: I second Erin’s words again here. The ArcGIS StoryMaps is a great way to break down what is often a complex or difficult topic to understand into bite-sized chunks of maps, charts, photos, and tantalizing illustrations. This is exactly what all science needs. What’s more, they can give a web presence to any researcher, beyond the scientific publication, to tell the story of their research findings.

Do you have any tips for someone interested in becoming an Arctic scientist and studying the Arctic like you?
Erin: I think there are lots of different ways that someone could get involved! I took a more academic route, but you could look into community science projects or volunteer with Arctic organizations. There are also lots of entry-level positions as interns, research assistants, or communication/outreach roles that would be a great way to get your foot in the door. And the Arctic community is actually really well connected, so usually, people know each other through the smaller circles.

What can people who don’t live in the Arctic do to help?
Erin: As someone who doesn’t live in the Arctic, I think raising awareness and helping to break misconceptions go a long way. But I’m not sure if Arctic residents would have a different answer or not.
Greg: Vote! Of course, the Arctic itself won’t be a part of your ballot, but those who understand and follow the principles of science will, and you can make your choice clear that science matters by helping to put them in office. Folks can also share the stories and results of Arctic research (like unstableground.org and woodwellclimate.org) with their networks.
This is important for the global climate because what happens in the Arctic doesn’t stay in the Arctic. Carbon that is released as greenhouse gases mixes with the global atmosphere and can further exacerbate climate change.
The Unstable Ground hub site is a wonderful example of how communication about science can be both creative and informative. By utilizing maps, numbers, charts, and ArcGIS Story Maps, Arctic scientists at the Woodwell Climate Research Center have helped make understanding the Arctic and its stories possible.
Images courtesy of Chris Linder Photography.