We are excited to announce yet another upcoming in-person Esri International User Conference (July 10-14, 2023) in San Diego in just a few short weeks! Read on to learn more about activities related to ArcGIS Aviation Charting and ArcGIS Aviation Airports.
Join us at the expo!
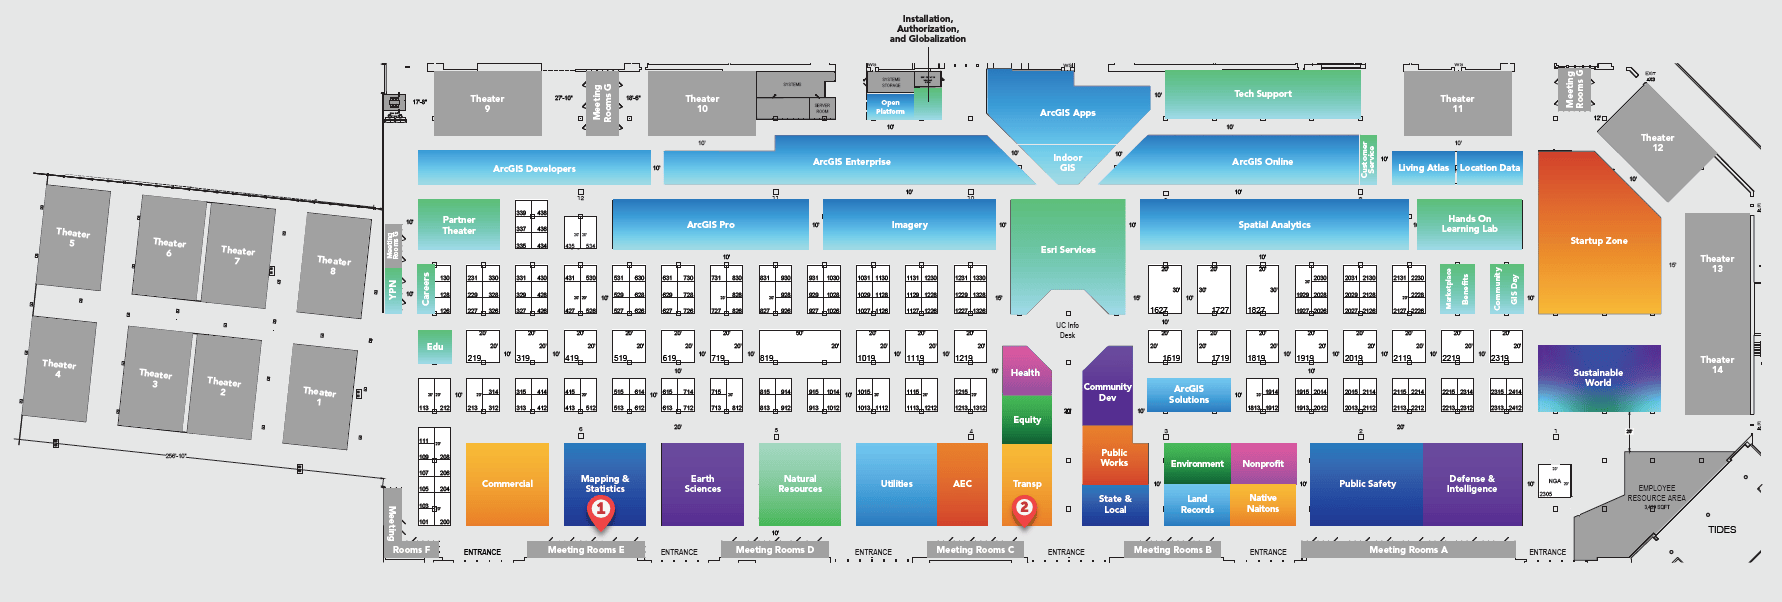
Our aviation experts will be available in two areas–Mapping and Statistics (Pin 1) and Transportation (Pin 2)–to answer your questions and show demos of the latest workflows, such as:
- Safety management systems (SMS) regulations for airports (Part 139) and wildlife hazard mitigation
- Managing NOTAMs digitally
Sessions
Below you can find a wide range of sessions tailored specifically for customers in the aviation community:
Automating Topographic Mapping
Technical Session | Tuesday, Jul 11 | 10:00 AM – 11:00 AM PDT | Room 30 C | In-person, recorded
This session will discuss topographic data management, map production tools, and workflows to automate creation of multi-scale data and cartographic products from a single best scale database. Learn how the latest developments in ArcGIS Production Mapping and ArcGIS Defense Mapping standardize and streamline data management and cartographic production tasks.
Imagery: An Introduction to Reality Mapping
Technical Session | Tuesday, Jul 11 | 2:30 PM – 3:30 PM PDT | Room 9 | In-person, recorded
Reality mapping is the process of creating accurate digital representations of the physical world using images, lidar, or both. Learn how Esri’s reality mapping capabilities enable you to generate photo-realistic 3D models, point clouds, high-resolution Orthomosaics, and elevation models using drone, aerial, and satellite imagery.
Reality Mapping with Drones: An Overview
Technical Session | Wednesday, Jul 12 | 8:30 AM – 9:30 AM PDT | Room 14 A | In-person, recorded
Technical Session | Thursday, Jul 13 | 10:00 AM – 11:00 AM PDT | Room 17 B | In-person, recorded
Learn how to perform Reality mapping using drones and derive insights from its outputs across the ArcGIS system—task, plan, and execute your data capture, process the imagery, share your outputs through customized web applications, and automate data analysis using AI. This session will take you through an end-to-end workflow, from flight planning and data capture to automated analysis for capturing drone imagery using Site Scan Flight, processing the raw imagery into 2D and 3D data products in the cloud using Site Scan Manager or locally using Drone2Map, sharing the content, and automating the analysis of the data.
Effectively Managing Airport Assets and Airport Safety Inspections
User Presentation | Wednesday, Jul 12 | 8:30 AM – 9:30 AM PDT | Room 28 B | In-person
Maintaining the operational safety of the airport airside is critical for passenger safety and smooth operations. These presentations highlight how GIS can support safer and more efficient airport operations.
Airports SIG: Embracing GIS as a Framework
Special Interest Group Meeting | Wednesday, Jul 12 | 11:30 AM – 12:30 PM PDT | Ballroom 20 BCD Room 2 | In-person
Join us this year’s SIG to celebrate wins in GIS and discuss together where we see GIS going for Airports! Together we will recognize the Airport Special Achievement Award winner, use this time to connect with industry experts plus your peers, and explore resources for your workflows. It is a SIG that you will not want to miss.
Enhancing Aviation and Airspace Analysis
User Presentation | Wednesday, Jul 12 | 2:30 PM – 3:30 PM PDT | Room 28 B | In-person
Maintaining airfield safety, maximizing operational efficiency, and minimizing flight schedule interruptions are challenges faced by all airports. These two user papers highlight how GIS can help make professionals jobs easier by leveraging different workflows.
Managing Lease Space and Work Orders at Airports using ArcGIS Indoors
Demo Theater | Wednesday, Jul 12 | 4:00 PM – 4:45 PM PDT | Expo Demo Theater 6 | In-person
In this session we will discuss the capabilities ArcGIS provides to improve the management and advertisement of your real estate holdings.
Resources
The UC Event Map is now available to allow you to get familiar with the convention center and view locations of sessions and activities before you go. You can also generate a route and directions between two locations and view the estimated travel time. Use this map as a helpful tool, along with the Detailed Agenda and My Schedule, for planning your UC experience. The map will also be available in the Esri Events App and at directory kiosks on site in the convention center. Learn more.
Here are additional aviation-specific resources.
We can’t wait to see you in San Diego!


It would be great to have an option to input a measure and zoom to the location and add a marker symbol. Currently at 2.9.2 the only option is to zoom to the entire route. I really don’t want to create an event table every time I want to find the location of a measure. This functionality exists in ArcMap by customizing and adding the “Identify Route Locations” tool under category “Linear Referencing”
Thank you for reaching out @Dan Regan. The ability to zoom to and label a route measure from the Find Routes pane is something we have in our backlog and are looking to complete in a future release.
Donald,
We use linear referencing for all our pipeline installation project. The measurement (MEAN) value (KP/STA) and distance (DIS) are our main relative reference values. Very often we wish to update the MEAS/DIS values based on a point’s XYZ location. What is the likelihood we will be able to populate these field (e.g. using the geographical calculator) within the same feature class? This would avoid the inconvenient work-around whereby a table with the MEAS/DIS values is exported and requiring a (temporary) join to copy the MEAS/DIS values across.
Robert
Hi Robert,
don’t believe I’m following your workflow. Are you saying that you currently run a combination of gp tools say Feature vertices to Points, Calculate Geometry Attributes, and Calibrate Routes?