I recently finished writing a 5-part tutorial series all about web cartography. Cartographic creations with web maps will teach you how to make professional quality web maps and apps with Map Viewer and ArcGIS StoryMaps. The video below shows what you will make and learn.
This tutorial series serves as a companion peice to Cartographic creations in ArcGIS Pro, and both are key content in the Introduction to Cartography course.
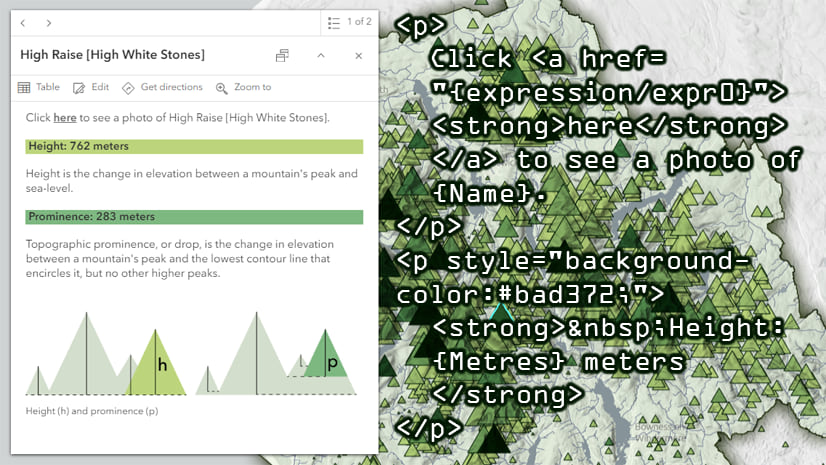
It teaches skills related to symbology, data management, projections, basemaps, pop-ups, labeling, visual hierarchy, data attribution, blend modes, effects, and layout design.

Decent article but is there a link to the actual code snippets? Pasting screenshots of code is less than helpful
You’re absolutely right. Having the actual snippets is better. I actually attempted to do that in this post, but this site blocks me from posting some of the snippets (I think for security reasons). At any rate, I should have made the links to the webmap where you can copy/paste the expressions directly from the webmap. You should be able to click on any of the images in the example to open the related webmap. Once it loads, open the popup to view the Arcade expression element and its code.
Hi. Is there a way to have the pie charts for the cluster show on the map as a symbol, rather than in a pop up?
Yes. That is coming in our next update. You should see a blog coming in the next couple of weeks introducing this.