This blog was written in collaboration with Joe Guzi, Senior GIS Systems Analyst at Stark County GIS, OH. Checkout his ArcGIS Monitor user success story here.
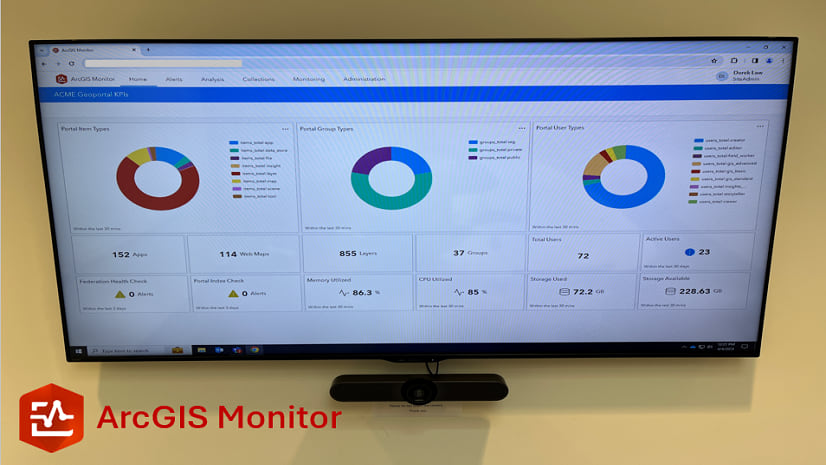
ArcGIS Monitor collects metrics focused on both ArcGIS Enterprise components and the underlying infrastructure. It provides a comprehensive overview of system health, performance, and helps administrators get the most from their GIS and IT investment.
An enterprise geodatabase is a collection of tables, views, stored procedures, and functions that stores an organization’s geographic data in a database. It is one of the primary data sources for ArcGIS web services and is typically part of an ArcGIS Enterprise deployment. An organization could potentially have many enterprise geodatabases as part of its enterprise GIS.
The objective of this blog is to demonstrate how to configure some useful charts in ArcGIS Monitor (as part of an analysis view) to report key metrics for an enterprise geodatabase (eGDB). The analysis elements discussed are:
- Number of connections to the eGDB
- Connections to the eGDB over time
- Number of versions in the eGDB
- Number of version states in the eGDB
- Number of state lineages in the eGDB
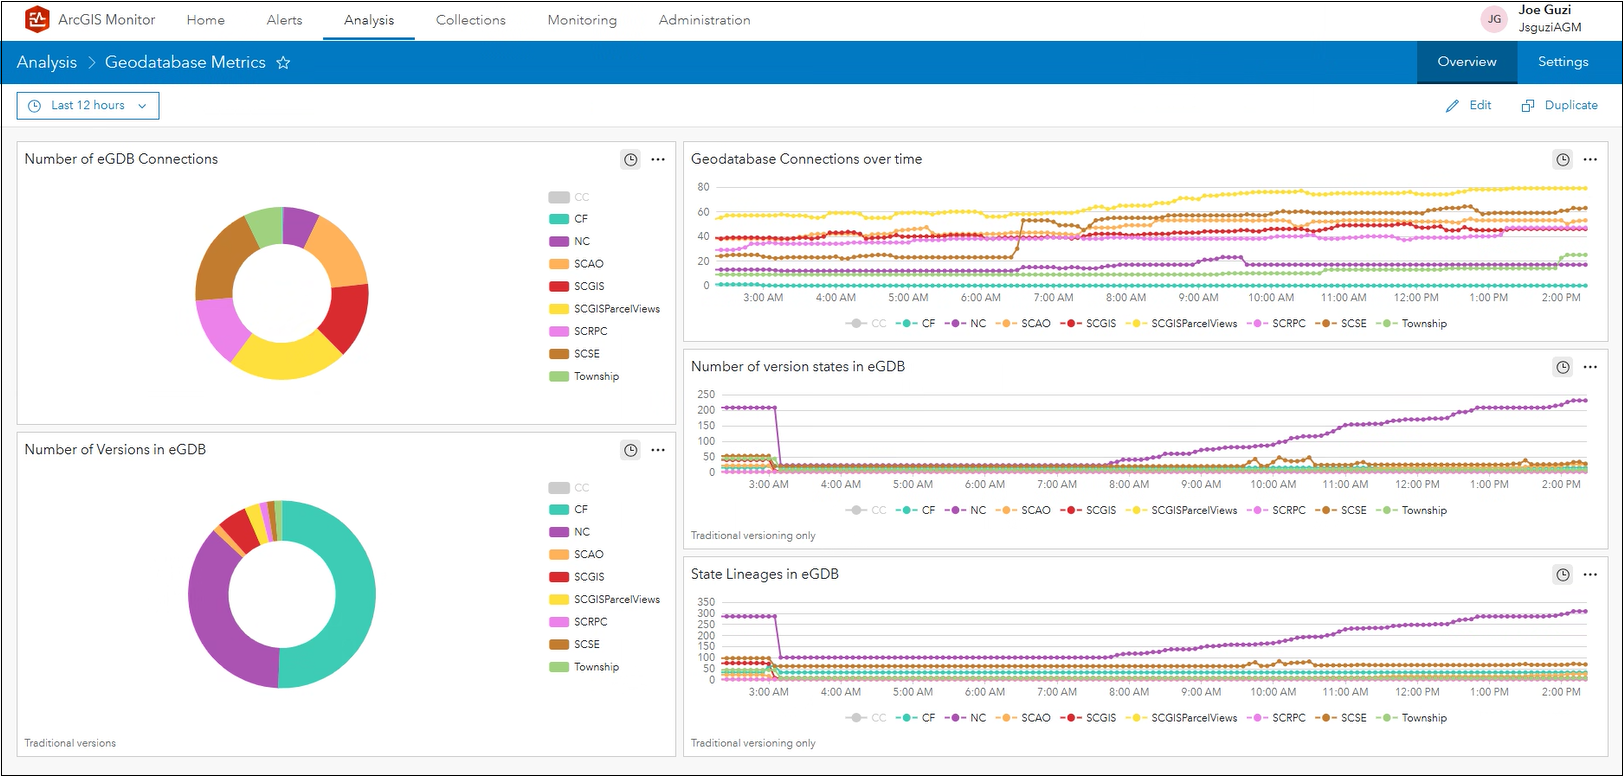
Configuring these analysis elements can yield the geodatabase analysis view below:
Preparation: if you have both databases and enterprise geodatabases registered with ArcGIS Monitor, we recommend that you create labels to differentiate between the two types of data sources. Monitor registers both as the same component type, but they offer different metrics.
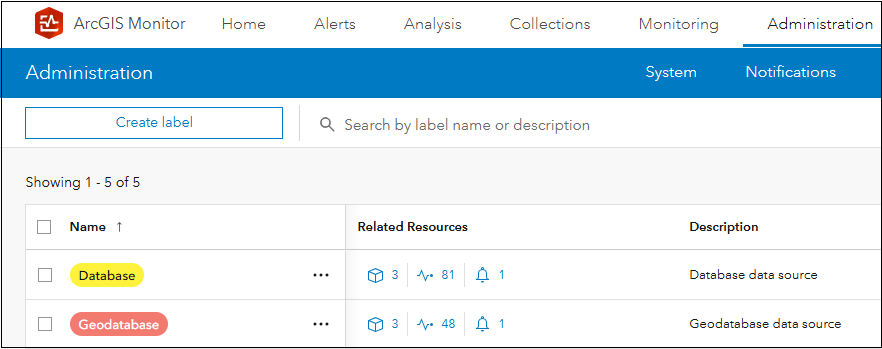
This blog is focused on enterprise geodatabase metrics and will utilize the “Geodatabase” label in the dataview expressions.
1. Total number of connections to the eGBD
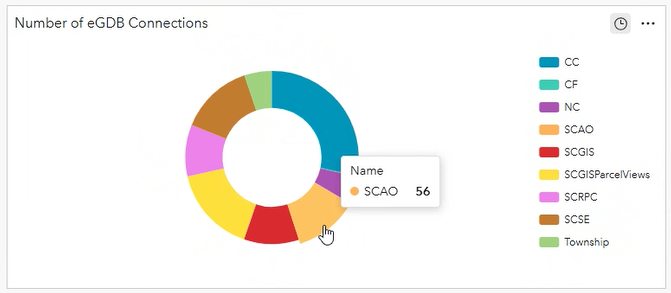
This donut chart displays the number of active connections to each enterprise geodatabase registered with ArcGIS Monitor. Hovering the cursor over a donut segment will display the connection count. Knowing of the number of connections can provide some context regarding the activity level on the eGBD. A high number of connections could impact performance, user experience and reliability of the geodatabase.
The dataview expression for the Number of connections to eGBD element:
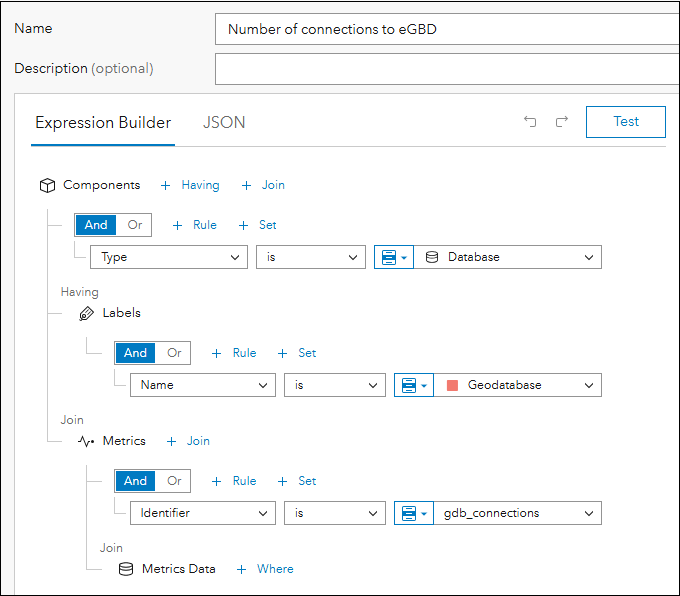
- Components where type is ‘Database’
- Having Labels where name is ‘Geodatabase’
(This assumes you have labeled your registered geodatabase components with this label. You could use an alternate label name – something that differentiates geodatabase components from database components.) - Join Metrics
- Identifier is ‘gdb_connections’
- Join Metrics Data
Conceptually, you are building an expression that is querying information across three tables in the ArcGIS Monitor database: Components, Metrics, and Metrics Data. FYI, “Metrics” refers to what is being measured and “Metrics Data” is the actual measurement.
The pie chart element can be configured as follows:
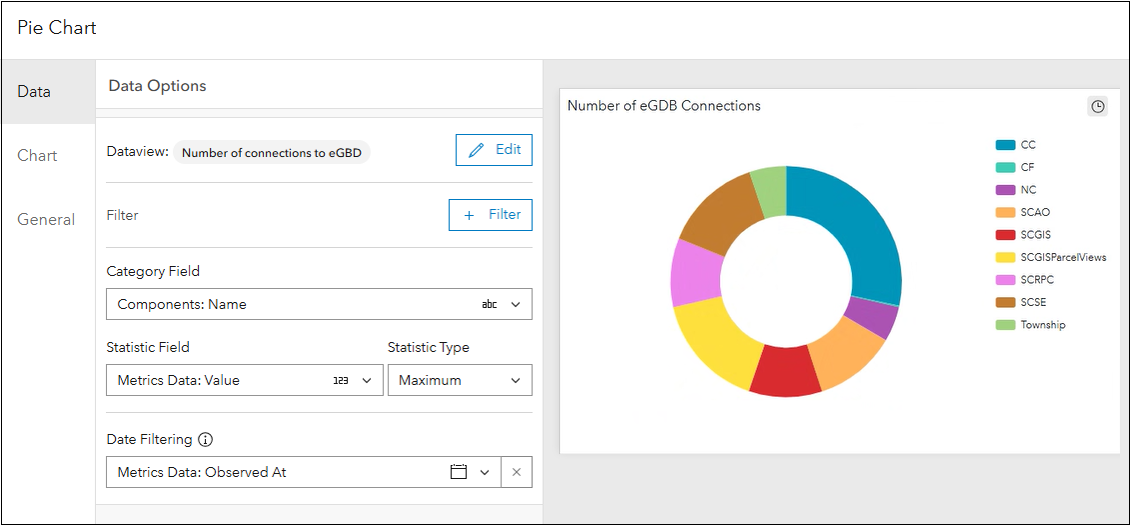
For Data tab
- Category Field is “Components: Name” – This will display the eGDBs being monitored
- Statistic Field is “Metrics Data: Value”
- Statistic Type is “Maximum” – We want the total connection count
- Date Filtering is “Metrics Data: Observed At”
For Chart tab
- Select Type as Donut
- Deselect Labels
- Select legend and position the legend at the right
For General tab
- Add a custom title for the pie chart
Additional properties can be configured for the pie chart, but they are not essential for the purposes of this blog.
2. Connections to the eGDB over time
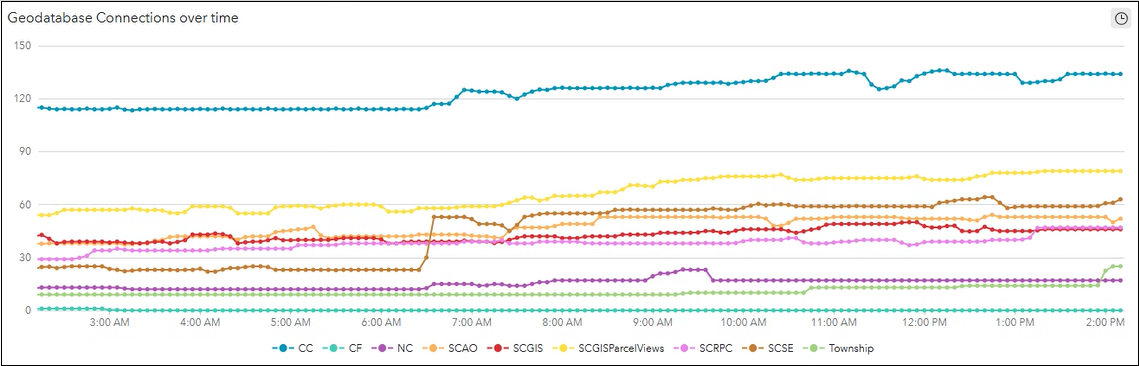
This serial chart shows the number of active connections to an enterprise geodatabase over time. This element can help reveal trends: are there time periods where more connections are made? Perhaps during certain business hours or days of the week? This can help with resource allocation decisions, for example: should I allocate more resources to the geodatabase during high activity time periods? It can also help identify periods of low activity, where admins could perform management tasks on the geodatabase and it will not adversely affect business workflows.
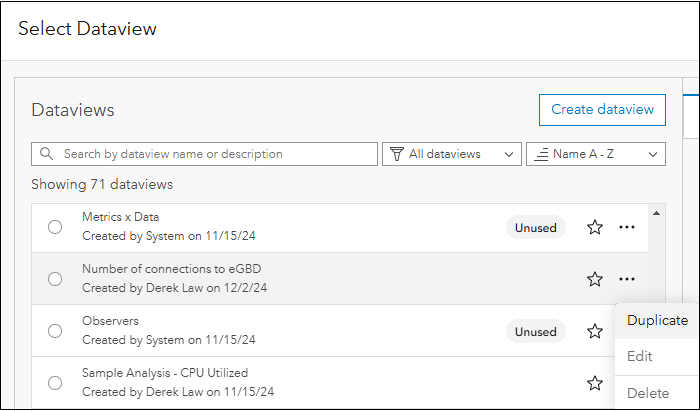
The dataview expression for this element is the same as for the previous Number of connections to the eGBD element. After you add a new serial chart element to the analysis view, on the Select Dataview panel, select the Number of connections to eGBD dataview > More options > Duplicate. This creates a copy of the dataview, rename the dataview to Connections to the eGDB over time.
The serial chart element can be configured as follows:
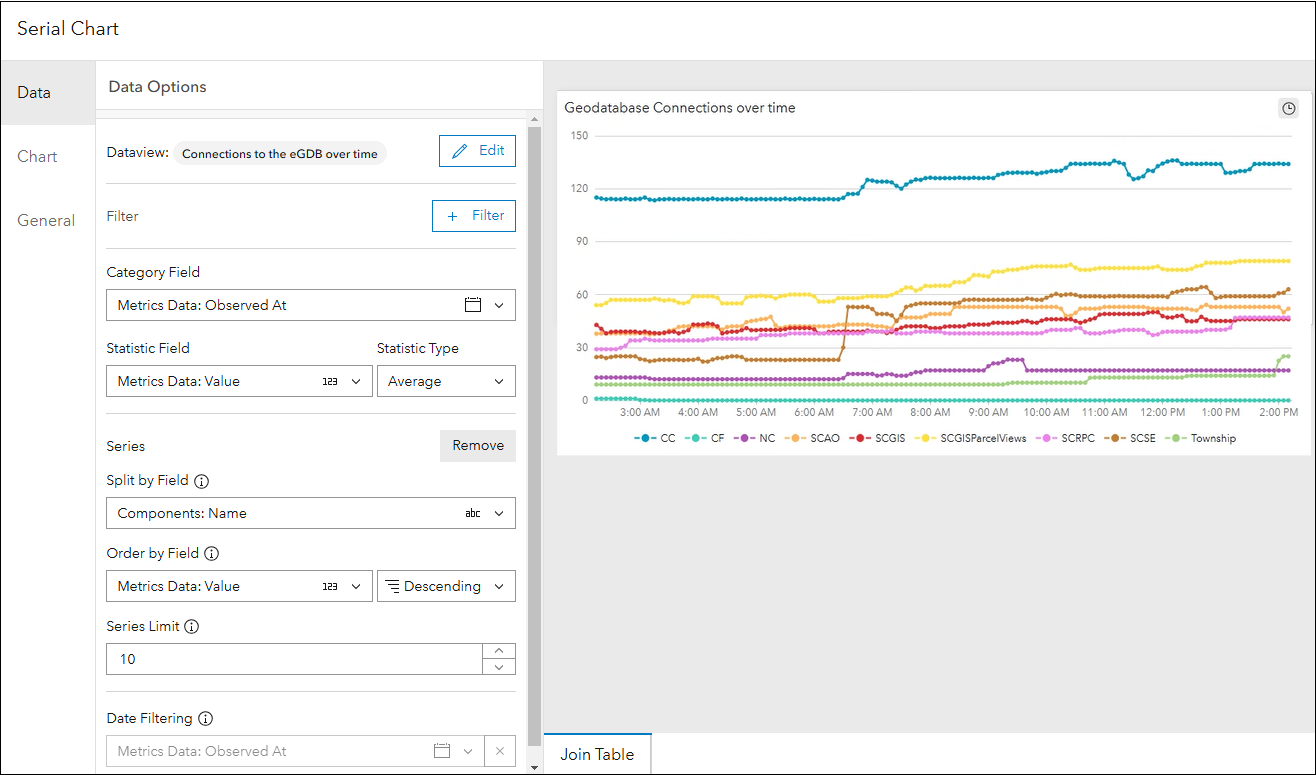
For Data tab:
- Category Field: Metrics Data: Observed At
- Statistic Field: Metrics Data: Value
- Statistic Type: Average
- Split by Field: Components: Name
- Order by Field: Metrics Data: Value and Descending
- Series Limit: 10
- Date Filter Enabled: Metrics Data: Observed At
For Chart tab:
- Type: Line
- Show Vertices: enable
- Orientation: Horizontal
- Format Series Name: {components.name}
- Legend: Enable
- Position: Bottom
- Show Related Alerts: on hover
For General tab:
- Add a custom title for the serial chart
Additional properties can be configured for the serial chart, but they are not essential for the purposes of this blog.
3. Number of versions in the eGDB
Enterprise geodatabases offer a capability called versioning, which enables multiple editors to access and edit the same data concurrently. This functionality supports many ArcGIS Enterprise workflows such as: editing, disconnected editing (e.g., to support mobile GIS), distributed collaboration, and geodatabase replication. There are two types of versioning:
- traditional – which supports direct edits to geodatabase data and
- branch – which is designed to support edits to web feature layers.
Learn more about versioning concepts and workflows here.
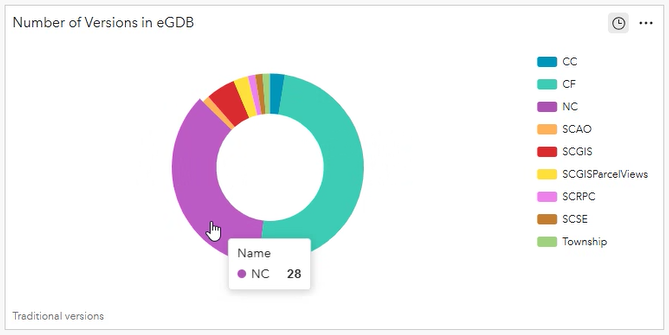
This donut chart displays the number of versions in each enterprise geodatabase registered with ArcGIS Monitor. Hovering the cursor over a donut segment will display the version count. This information helps administrators understand the current state of data edits in the eGDB, manage concurrent editing workflows, and can help ensure data integrity. It provides insight into the complexity of editing in the eGDB.
Depending on the frequency of editing, disconnected editing, distributed collaboration, and geodatabase replication workflows in your enterprise GIS, your eGDBs might have tens to hundreds to thousands of versions. To help maintain geodatabase performance, ensure you are actively managing versions by performing reconcile and post operations on a regular cadence.
The dataview expression for the Number of versions in eGBD element:
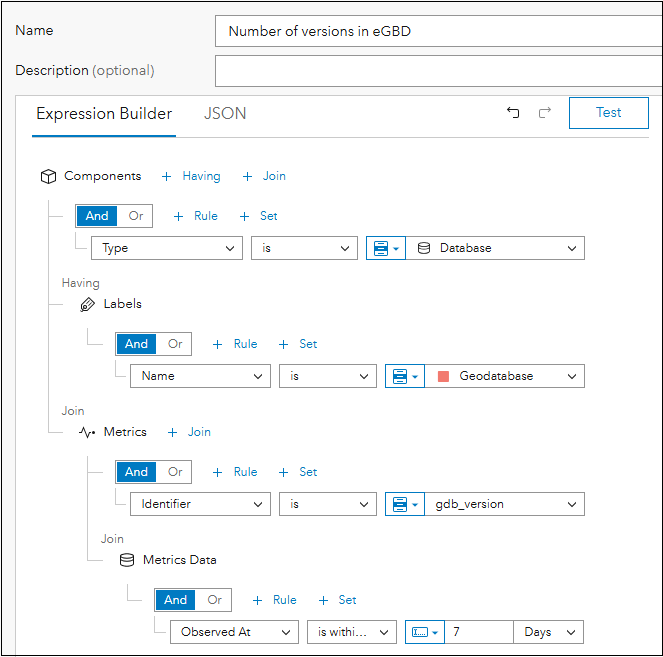
- Components where type is ‘Database’
- Having Labels where name is ‘Geodatabase’
(This assumes you have labeled your registered geodatabase components with this label. You could use an alternate label name – something that differentiates geodatabase components from database components.) - Join Metrics
- Identifier is ‘gdb_version’
(This will query for traditional version types only) - Join Metrics Data
- Observed At is within the last 7 days
Side note: You could create a separate dataview for branch versions, then display in a separate donut chart. To query for branch version types, Identifier is ‘gdb_branches’. For the purposes of this blog, we are only showing the number of traditional versions in an eGDB.
The pie chart element can be configured as follows:
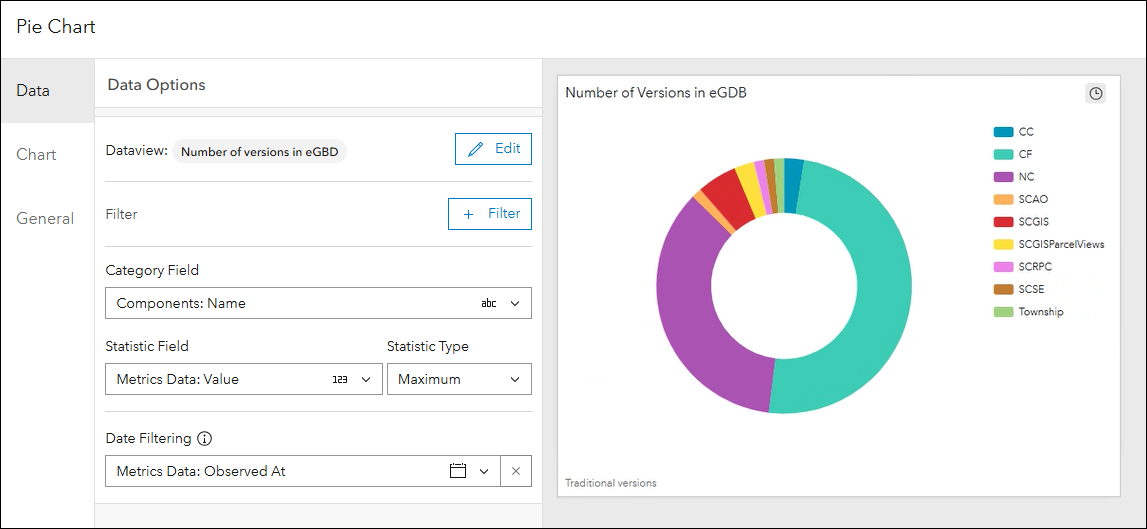
For Data tab
- Category Field is “Components: Name” – This will display the eGDBs being monitored
- Statistic Field is “Metrics Data: Value”
- Statistic Type is “Maximum” – We want the total version count
- Date Filtering is “Metrics Data: Observed At”
For Chart tab
- Select Type as Donut
- Deselect Labels
- Select legend and position the legend at the right
For General tab
- Add a custom title for the pie chart
- For Description input: “Traditional versions”
4. Number of version states in the eGDB
In traditional versioning, any edit made to data in the enterprise geodatabase (e.g. add, delete, or update), is recorded as a state change. eGBDs with high state counts indicate a high level of editing activity and over time, they will encounter performance issues if left unmanaged. It is therefore important to manage states by performing a geodatabase compress on a regular basis. A compress operation will delete states not referenced by a version.
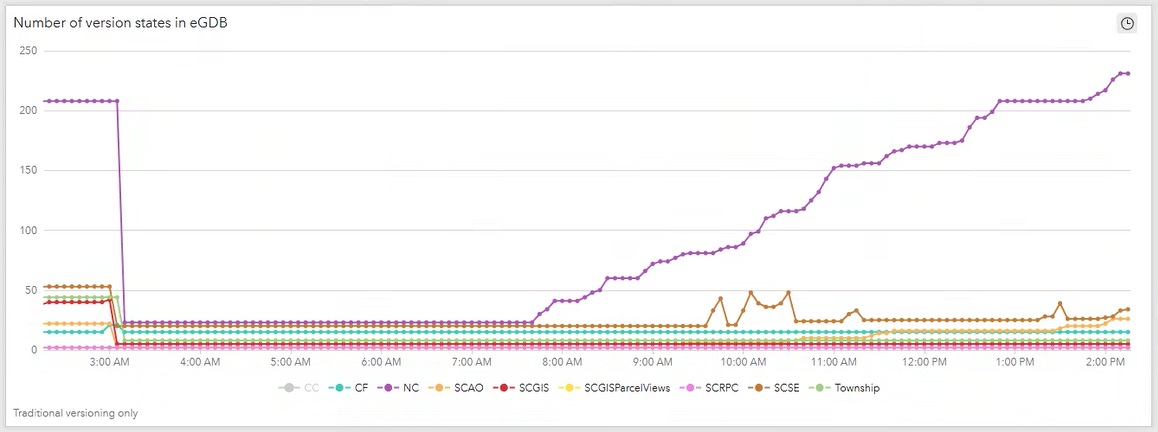
This serial chart shows the number of version states in an enterprise geodatabase over time. Viewing states over time can reveal time periods of high editing activity in the eGDB. When eGDBs have very high state counts, then it would be wise to plan some time to perform some version management or a geodatabase compress to maintain geodatabase performance.
Observe in the serial chart that the state count dramatically decreased around 3 am. This is because a compress was applied to the eGDBs. As edit workflows were performed the next day, the state count for the NC and SCAO geodatabases gradually increased.
The dataview expression for the Number of version states in eGBD element:
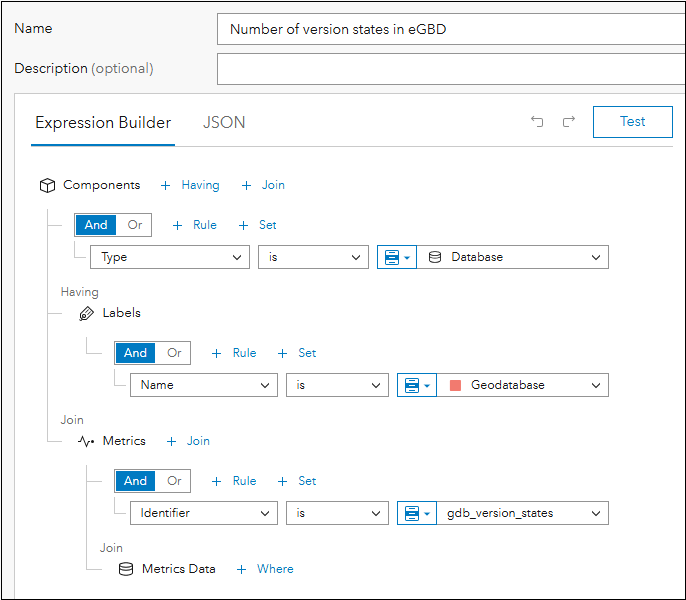
- Components where type is ‘Database’
- Having Labels where name is ‘Geodatabase’
(This assumes you have labeled your registered geodatabase components with this label. You could use an alternate label name – something that differentiates geodatabase components from database components.) - Join Metrics
- Identifier is ‘gdb_version_states’
- Join Metrics Data
The serial chart element can be configured as follows:
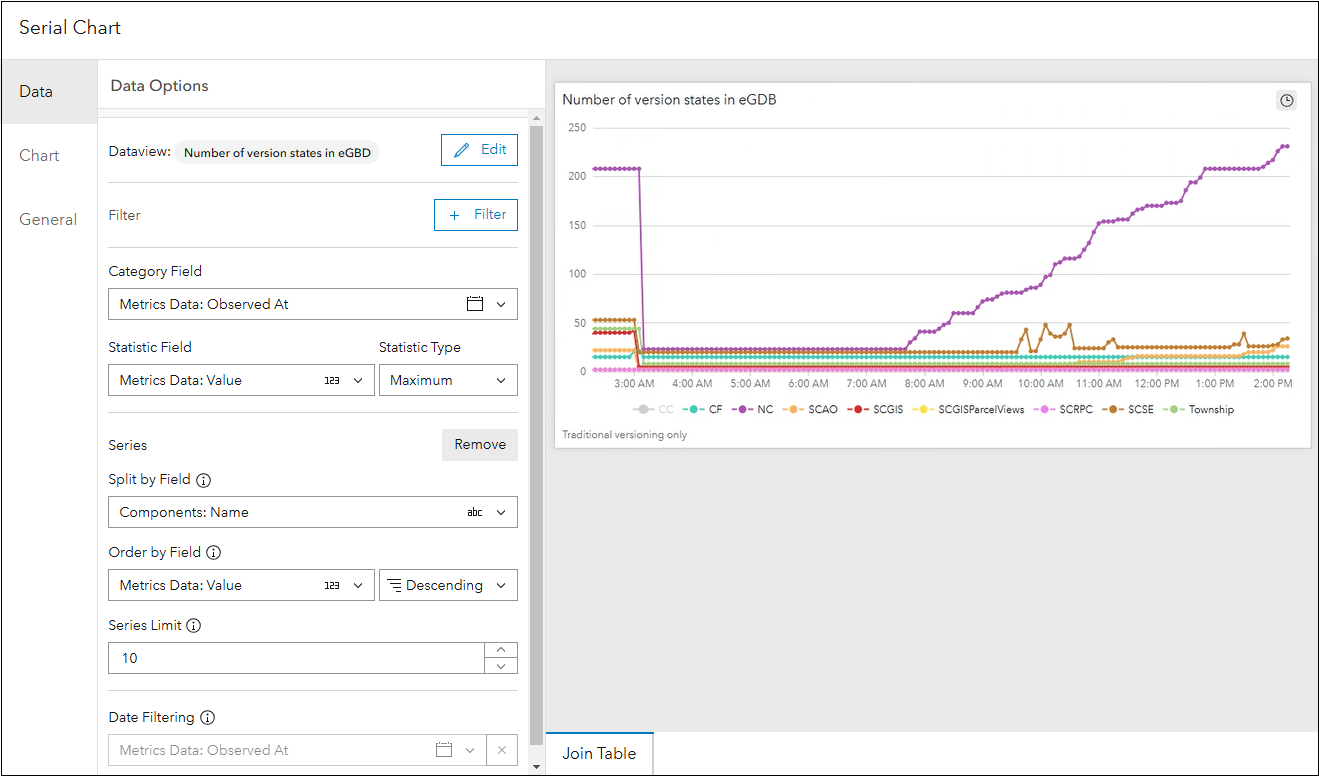
For Data tab:
- Category Field: Metrics Data: Observed At
- Statistic Field: Metrics Data: Value
- Statistic Type: Maximum
- Split by Field: Components: Name
- Order by Field: Metrics Data: Value and Descending
- Series Limit: 10
- Date Filter Enabled: Metrics Data: Observed At
For Chart tab:
- Type: Line
- Show Vertices: enable
- Orientation: Horizontal
- Format Series Name: {components.name}
- Legend: Enable
- Position: Bottom
- Show Related Alerts: on hover
For General tab:
- Add a custom title for the serial chart
- For Description input: “Traditional versioning only”
5. Number of state lineages in the eGDB
In traditional versioning, a state lineage or “state tree” is a sequence of states, starting with the beginning state and ending with the current state. It represents a series of changes made to a enterprise geodatabase. Each branch in the tree or lineage records how a version has evolved. This concept is explained and discussed in detail in the ArcUser article Versioning 101.
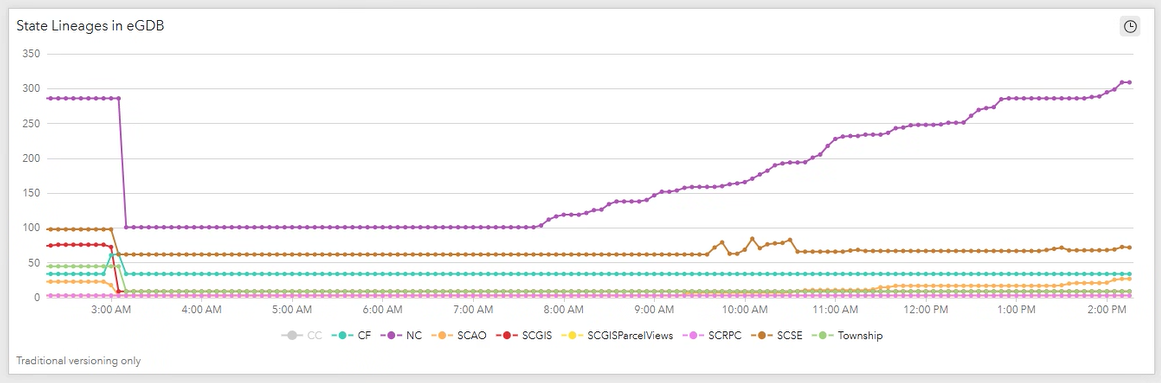
This serial chart shows the number of state lineages in an enterprise geodatabase over time. Observe in the serial chart that the state lineages count dramatically decreased around 3 am. This is because a compress was applied to the eGDBs. As with viewing states, displaying state lineages over time can reveal time periods of high editing activity in the eGDB.
The dataview expression for the Number of state lineages in eGBD element:
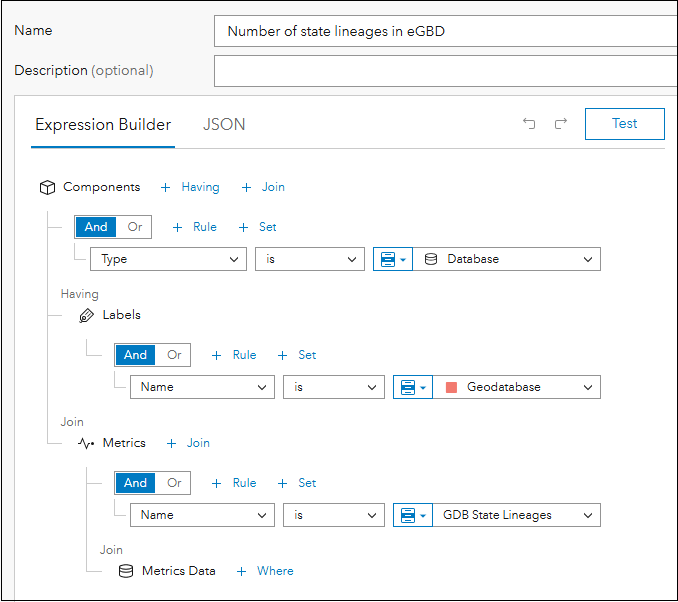
- Components where type is ‘Database’
- Having Labels where name is ‘Geodatabase’
(This assumes you have labeled your registered geodatabase components with this label. You could use an alternate label name – something that differentiates geodatabase components from database components.) - Join Metrics
- Name is ‘GDB_State_Lineages’
- Join Metrics Data
The serial chart element can be configured as follows:
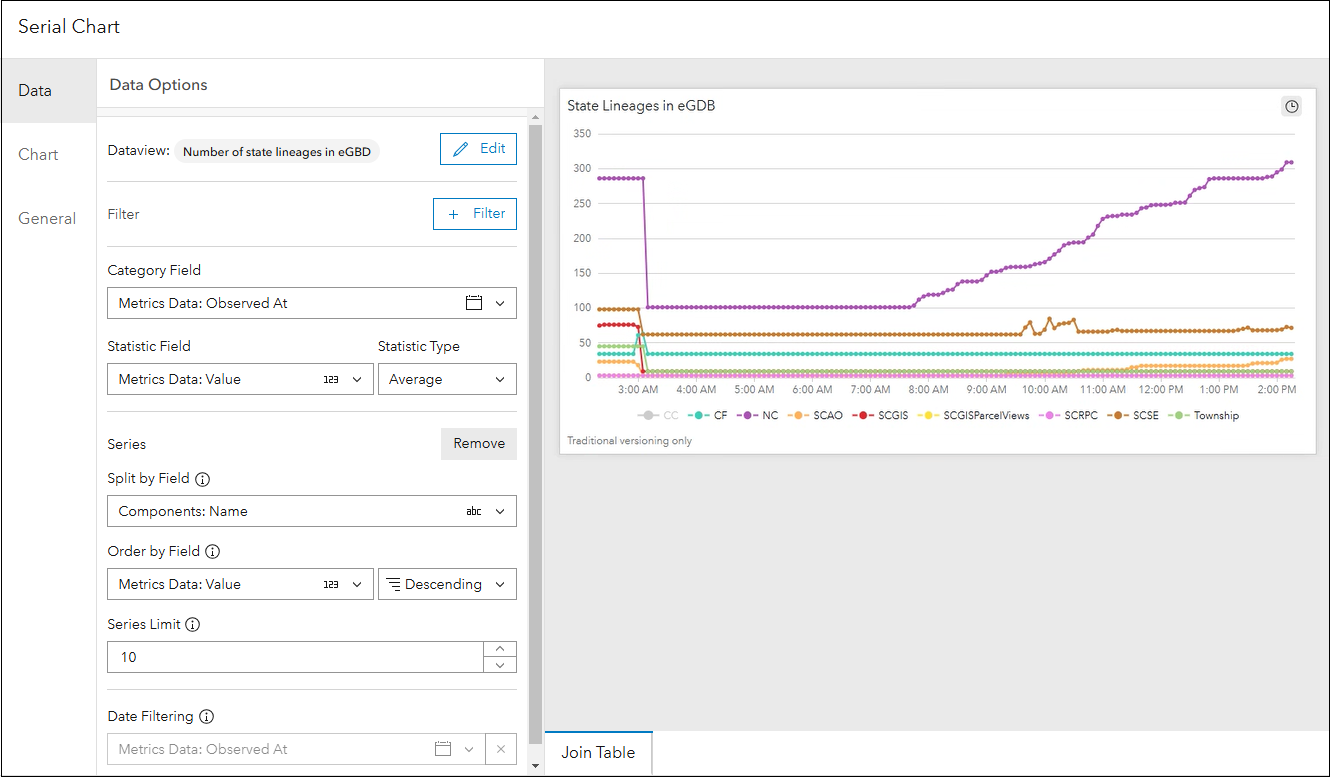
For Data tab:
- Category Field: Metrics Data: Observed At
- Statistic Field: Metrics Data: Value
- Statistic Type: Average
- Split by Field: Components: Name
- Order by Field: Metrics Data: Value and Descending
- Series Limit: 10
- Date Filter Enabled: Metrics Data: Observed At
For Chart tab:
- Type: Line
- Show Vertices: enable
- Orientation: Horizontal
- Format Series Name: {components.name}
- Legend: Enable
- Position: Bottom
- Show Related Alerts: on hover
For General tab:
- Add a custom title for the serial chart
- For Description input: “Traditional versioning only”
Analysis view of Enterprise geodatabase metrics
Configuring these analysis elements for your registered enterprise geodatabases can provide insights on their activity and usage in ArcGIS Monitor. This can help administrators better understand how the eGDBs are being used by the organization and understand time periods of high editing activity. Managing versions and state | lineage counts in enterprise geodatabases can help with their overall performance.
Some additional resources:
- Enterprise geodatabase management help topic
- ArcGIS Monitor help documentation
- ArcGIS Monitor: An Overview – Esri UC 2024 tech session video
- ArcGIS Monitor: Techniques for Analyzing Common Operational Scenarios – Esri Dev Summit 2024 tech session video
- ArcGIS Monitor User Group Meeting 1 – Analysis Views video (featuring Joe!)
- Esri Community
Sincerely,
The ArcGIS Monitor team and Joe Guzi

Article Discussion: