Williams, an energy infrastructure company, owns and operates midstream gathering and processing assets as well as interstate natural gas pipelines. Founded in 1908, Williams employs more than 5,600 people. With headquarters in Tulsa, Oklahoma, Williams also operates major offices in Houston, Texas; Pittsburgh, Pennsylvania; Oklahoma City; and Salt Lake City, Utah.
The geographic information system (GIS) environment at Williams includes a Citrix environment with an average of 120 ArcGIS Desktop users and supports 63 development, QA, and production servers (mostly virtual). The clustered ArcGIS Server environment hosts services and 164 maps. A federated ArcGIS portal runs 238 services, 199 maps, 30 feature services, and accommodates 1,800 users. With so many workers depending on GIS maps and services, Williams needed to be able to proactively monitor its implementation.
“Any time a web map or map service wasn’t working correctly, we would have to research what’s causing the issue,” said Steve McCarthy, a systems architect at Williams. “We’d start by looking at the web app, then maybe end up having to dig into the code to figure out what’s not working right. This could take several hours or days.”
McCarthy and his team would have to take time away from projects to determine the cause of the problem — whether it be a broken link, a bad index, or an underpowered service. He and his team needed to be able to identify problems or potential problems and to reliably run multiple applications in their GIS environment. This would allow qualified staff to focus on creating new applications or fine-tuning current applications rather than troubleshooting.
Williams implemented ArcGIS Monitor, a tool uniquely tailored to monitor the health of ArcGIS implementations. ArcGIS Monitor provides insightful information about system usage and performance via non-invasive monitoring of enterprise GIS and IT infrastructure, including databases, networks, and GIS software.
The solution provides timely detection of potential and existing system infrastructure and operational problems to facilitate a rapid resolution. It also provides actionable reports and quantifiable metrics to improve communications among GIS and IT staff, business owners, and senior management.
Since implementing ArcGIS Monitor, Williams has reduced the amount of time spent on troubleshooting and response. The company has also been able to save the cost of extra resources by making those purchases only when proven to be necessary.
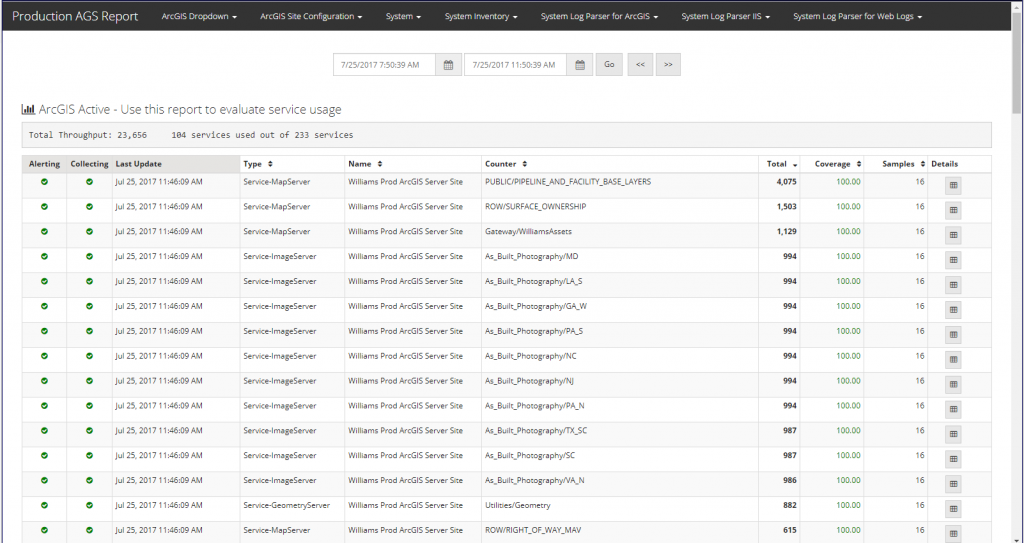
“ArcGIS Monitor provides reports that are very helpful,” McCarthy said. “It lets us see where there is heavy traffic. The Excel reports show me where I might have issues, such as broken links or data change by hour or over a period of time.”
With a better grasp of available resources, McCarthy and his team can quickly determine how much growing room they have, and when they may need to add resources such as extra servers, storage, memory, or CPUs. His team uses ArcGIS Monitor reports to justify the use of current resources and the need for more.
McCarthy can fine-tune the ArcGIS Server environment at Williams to cater to which services are popular. He uses feedback from ArcGIS Monitor to increase resources based on heavy activity or decrease them based on low activity. While McCarthy elected to receive alerts from ArcGIS Monitor when the server reaches 75 percent capacity, users can set alerts to any desired size or percentage of capacity. ArcGIS Monitor also provides hourly reports on all systems. The team at Williams makes these published reports available to developers and users who need relevant information.
“We’ve gone from responding to issues to proactive, high-performance tuning,” McCarthy said. “Now, we don’t go buy extra resources unless we can justify it. In the past, we would only be able to assume we need more memory or more servers. ArcGIS Monitor helps build confidence in our GIS because we have very little downtime.”
Article Discussion: