
Delivering fiber backhaul to potentially tens of thousands of new and existing cell sites requires careful planning to optimize the fiber routes. This traditionally manual, costly, and time consuming process can now be automated using spatial analysis tools. Esri offers a Backhaul Optimization model solution template that is built on the ArcGIS Network Analyst extension for ArcGIS Desktop. When given a set of wireless access points (for example, cell towers) and a set of network access points, the Backhaul Optimization model will quickly generate an optimized network topology and routing plan detailing how cell sites can be connected to the network.
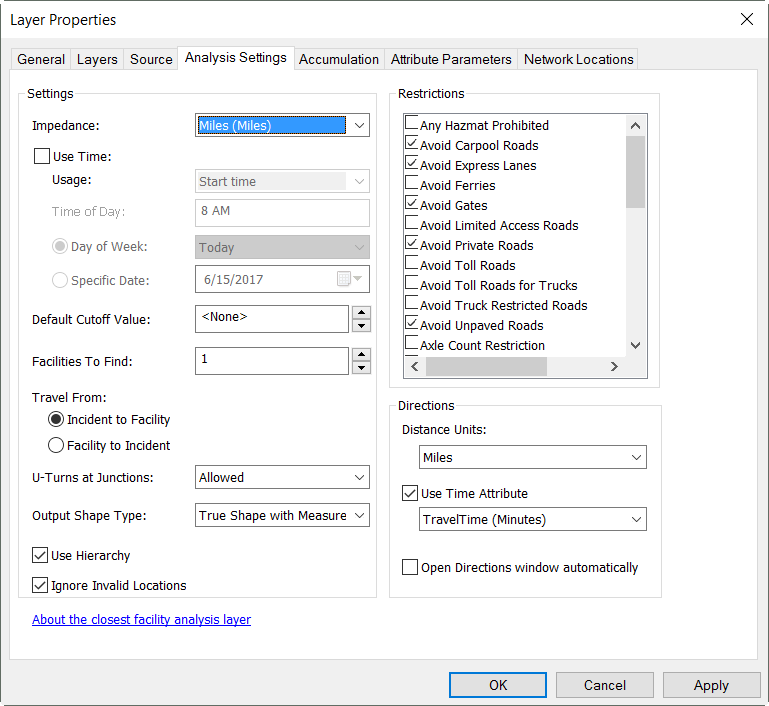
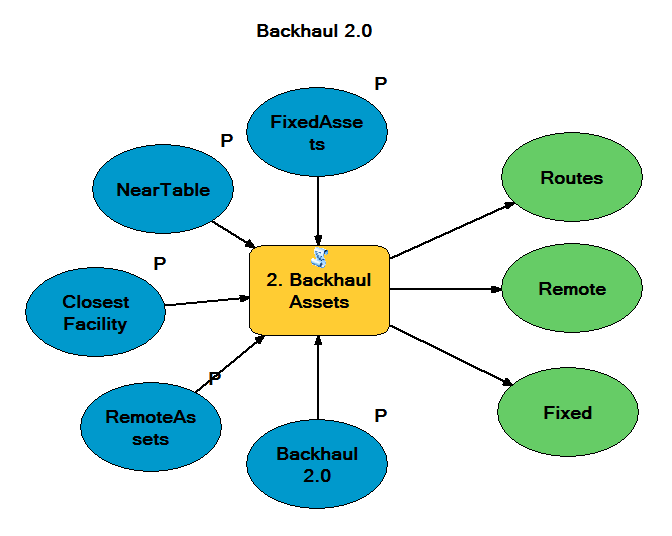 The Backhaul Optimization model utilizes a spatial analysis tool in ArcGIS Network Analyst called, Closest Facility solver. The closest facility solver measures the distance between cell sites and network access points and determines the least cost route. The closest facility solver then displays the best routes between cell sites and the network, and reports their cost and length. To perform the routing, the closest facility solver requires a network dataset, like the one available in StreetMap Premium for ArcGIS.
The incorporated closest facility solver in the Backhaul Optimization model allows the user to define max number of cell sites to daisy chain together, select the analysis criteria using an impedance value (like shortest distance, least cost path, or number of businesses passed), and set any barriers, like railroad crossings, that should be avoided when designing routes.
The Backhaul Optimization model does require the locations (Lat/Long or Address) of the cell towers and network access points. If the the locations of the network access points are unavailable, then the existing fiber backbone routes can be used. In the latest release of the Backhaul Optimization model, version 2.0, the model optimized the routes for 429 remote sites in under 3 minutes. To learn more about the Backhaul Optimization model and to see a video of the model in action, check out this Story Map.
Article Discussion: