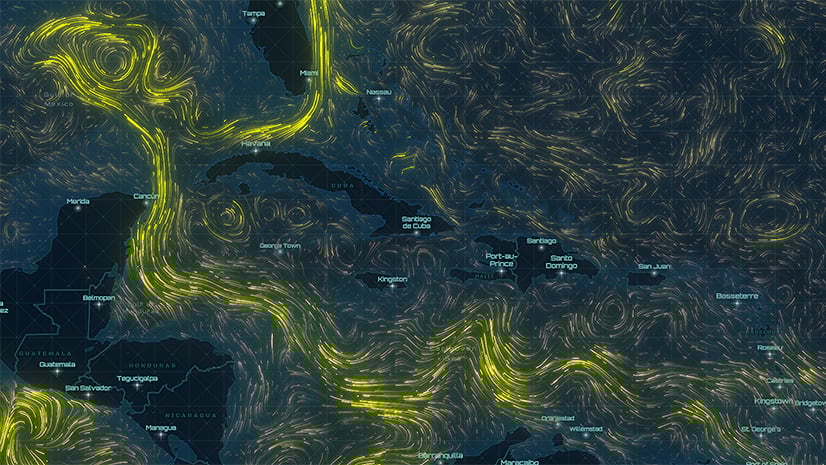
In the March release of Map Viewer and the ArcGIS API for JavaScript, we introduced an exciting new flow style to visualize magnitude and direction in imagery layers.

While we do provide some layers that work well with this new style in the Living Atlas, you probably want to know how you can use this new style with your own data. If so, you’ve come to the right place! Today, I’m going to walk you through how you can publish data and prepare it for use with the Flow style, all within ArcGIS Online.
Step 1: Get the data
To create a flow visualization, your raster data must be comprised of either a pairing of magnitude/direction or U/V where U and V represent the horizontal and vertical components of a vector respectively. As long as the data has fields representing magnitude and direction or U and V, then the dataset can be used to visualize flow.
This dataset from the North American Land Data Assimilation System contains U and V fields representing wind speed at an hourly time period over the past 43 years.
To download the data, first create an Earthdata account. Then, click Subset / Get data. Since we don’t want to download all the data (there’s so much data – it would take a long time to download everything!), select download method Get file subsets, specify the date range you want, and select UGRD and VGRD, which will be used to calculate magnitude and velocity. Then, select netCDF as the output format.

Click Get data and use the links provided to download the data. Since this is hourly data, a link will be provided for each hour in the date range you selected. If you just want to show the data at one slice in time, you only need to download one of the links.
Step 2: Publish the data
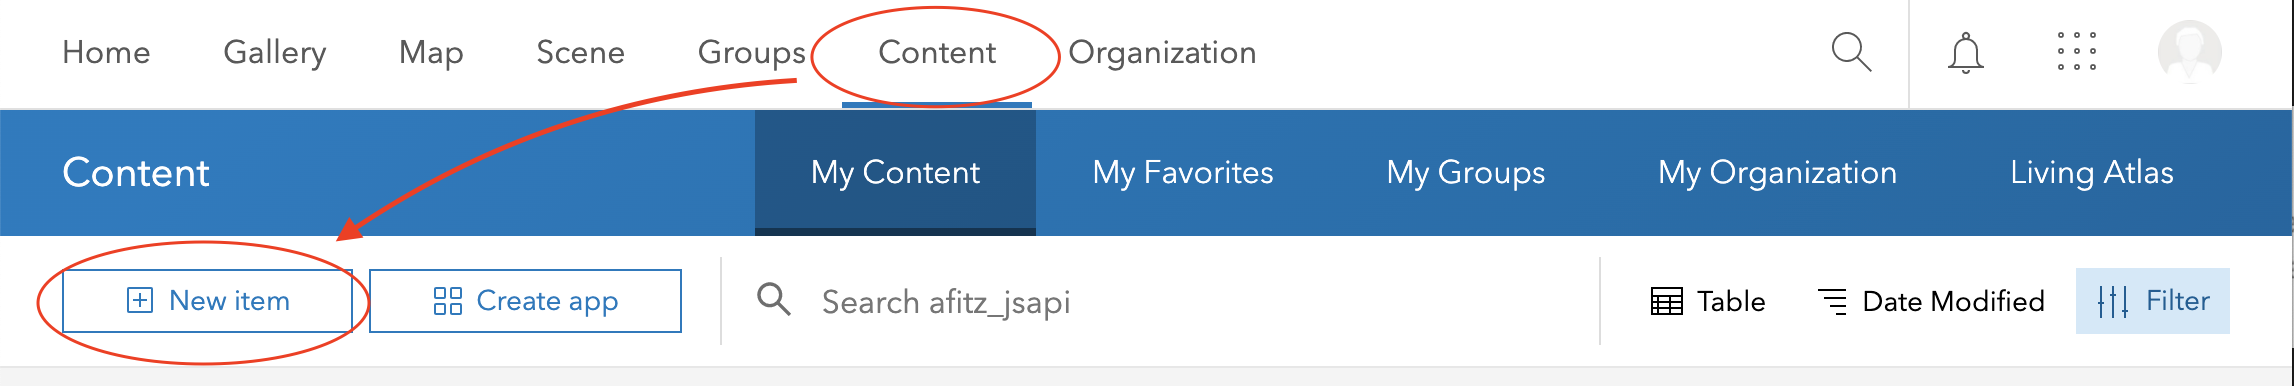
Now that you have your data, the next step is to publish it as a dynamic imagery or tiled imagery layer. Log in to ArcGIS Online or your portal instance, and go to the Content tab. Use the Add Item button to start the process of publishing your data.
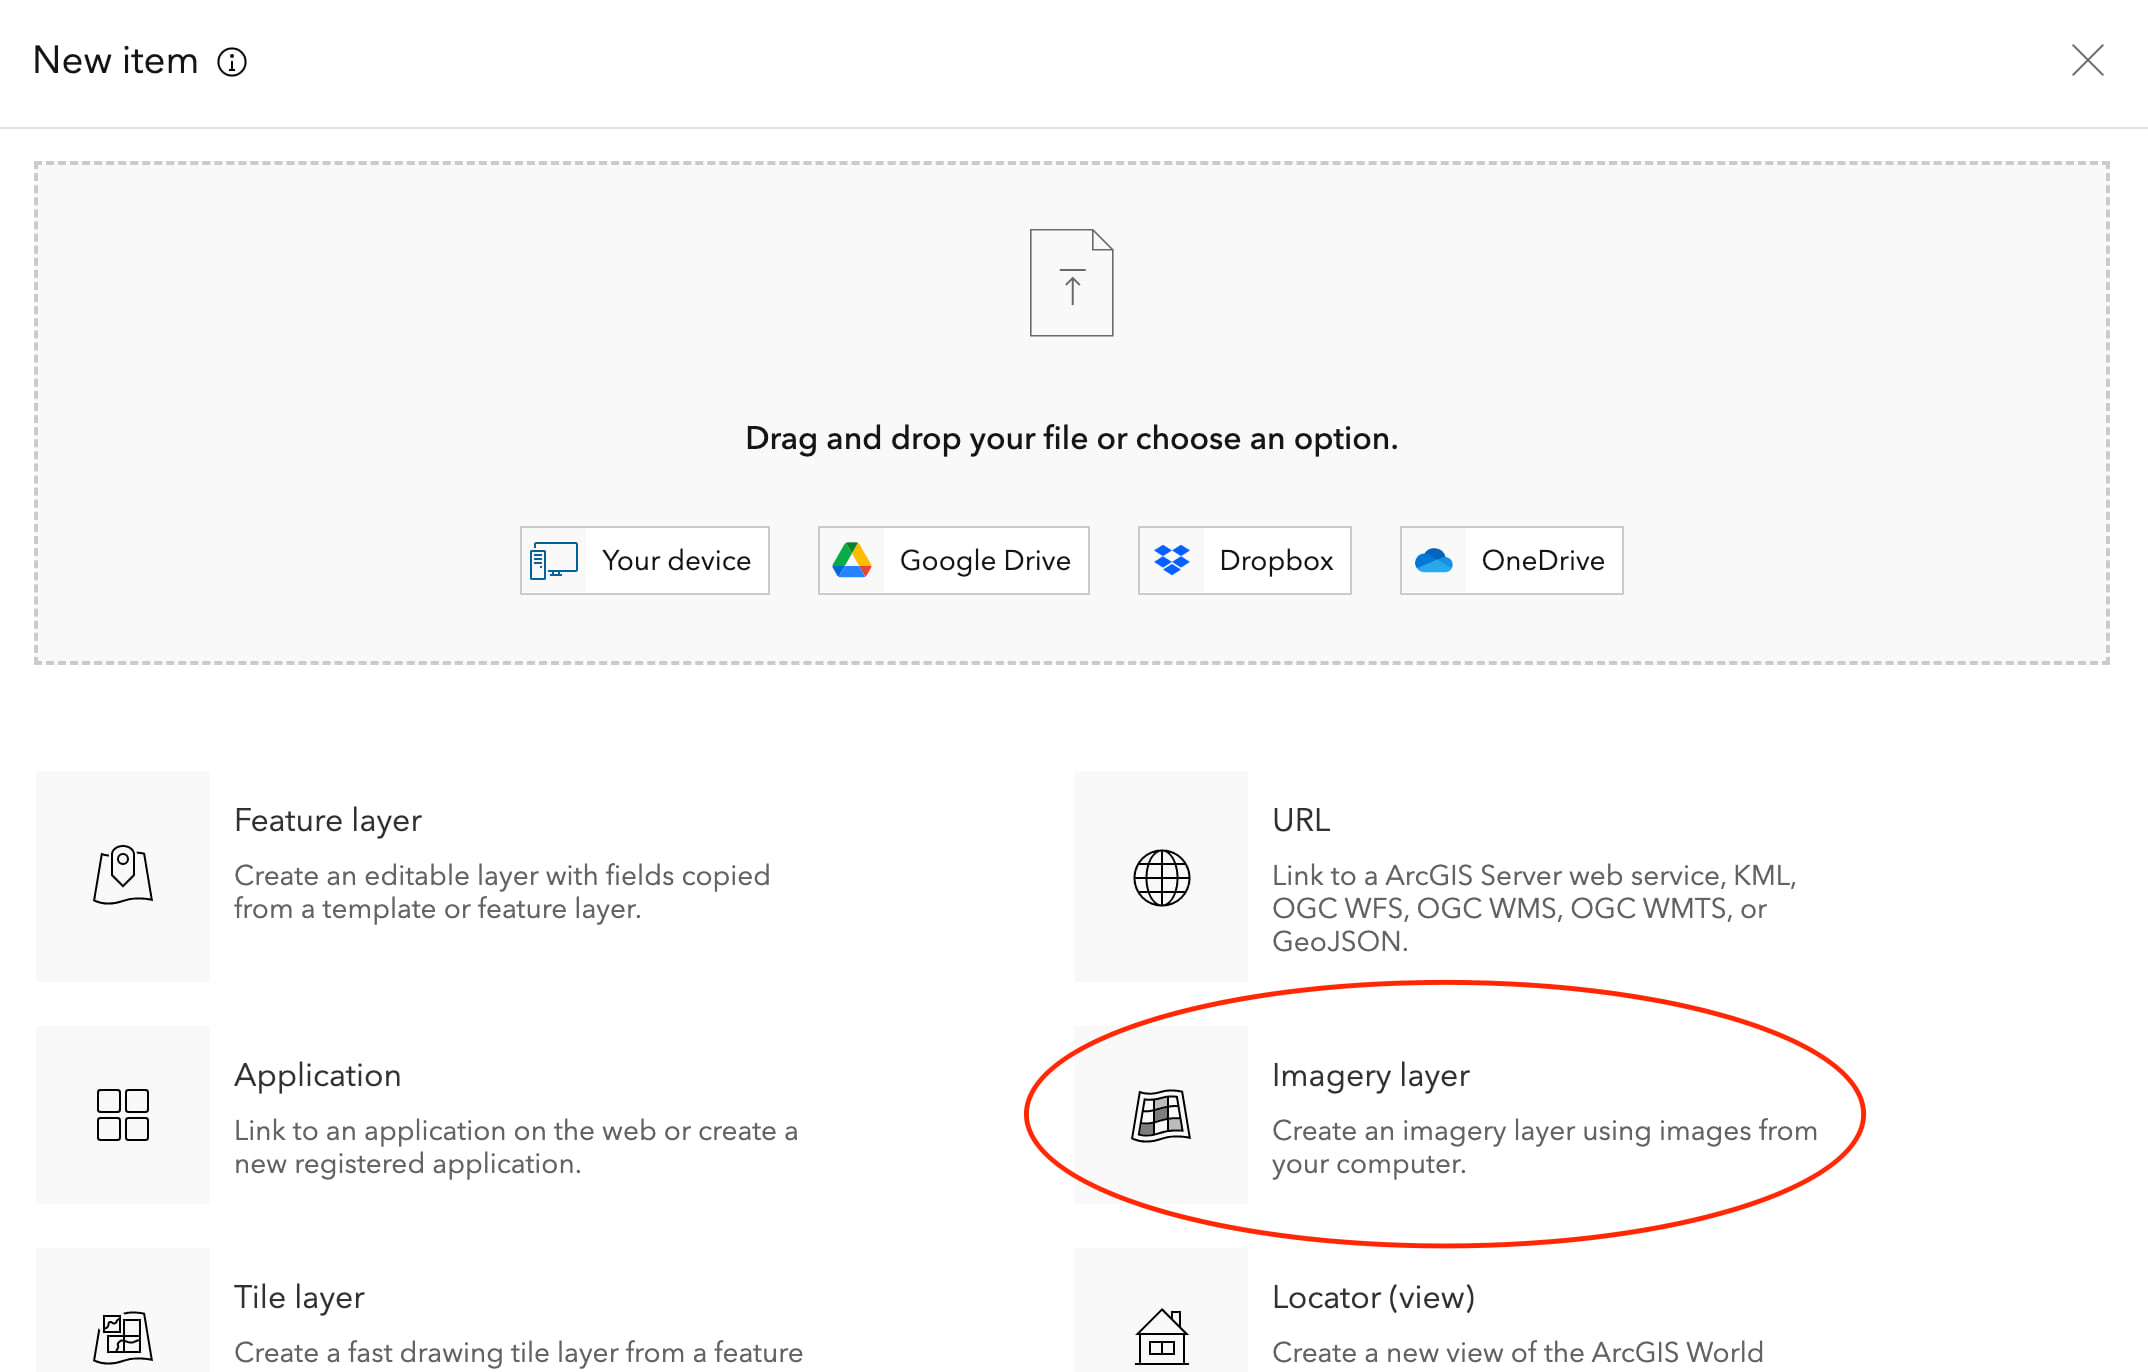
In the New item menu that appears, select Imagery layer.
Then, complete the following steps.
- Select layer type: Tiled Imagery Layer or Dynamic Imagery Layer. Both layer types work with the FlowRenderer, but the Tiled Imagery Layer will give you faster performance.
- Configure layer: Choose One Image if the data is stored in a single file, or choose One Mosaicked Image if the data is stored in multiple files.
- Define imagery: Choose the raster type that describes the imagery files, then add image files to the Select input imagery box.
- Set item details: Give the layer a name and description and select
Createto publish it.
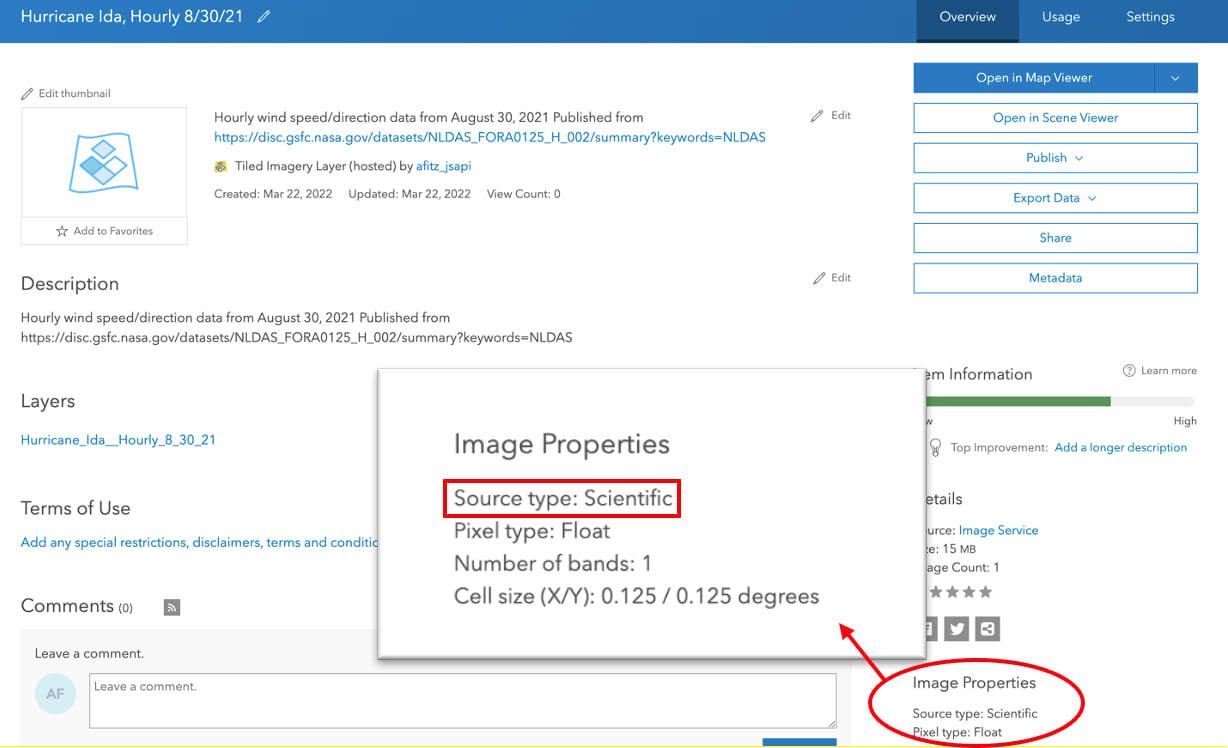
Once publishing has completed, you should be able to view the item’s page that contains information about the data you’ve just published – here’s mine.
Step 3: Process the data
The FlowRenderer only supports ImageryLayers or ImageryTileLayers with a source type of Vector-MagDir or Vector-UV. The layer we just published has a source type of Scientific – so we need to do some image processing before we can use this data with the Flow style.
I’m going to walk through how to process data in ArcGIS Online using the raster analysis capabilities in Map Viewer Classic. Check out Visualize raster using a vector field in ArcGIS for more information about the different options for processing data in ArcGIS Pro and ArcGIS Online.
Open the layer in Map Viewer Classic. Since this is an ImageryTileLayer, only the variables on the client will be available for analysis. To work around this, make a copy of the layer, and update the variable selected in the Multidimensional Filter. One layer should be displaying ugrd and the other should be displaying vgrd. If you are using a dynamic imagery layer, you can skip this step.
Now we are ready to perform the analysis. Get started by selecting the Analysis tab.
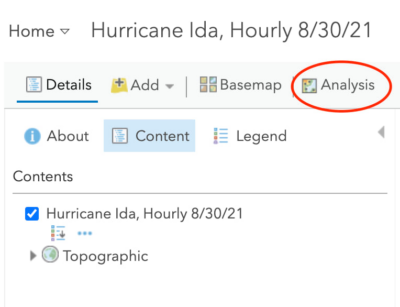
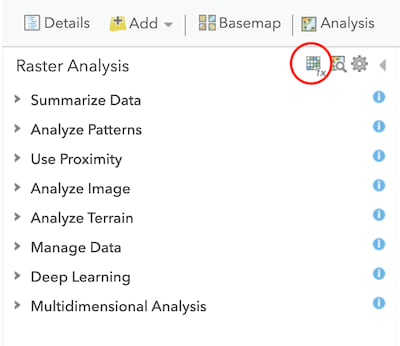
Select Raster Analysis. We need to convert our Scientific imagery layer to the supported Vector-MagDir source type. To do this, we need to create a new raster function by clicking on the Raster Function Editor button shown in the red circle below.
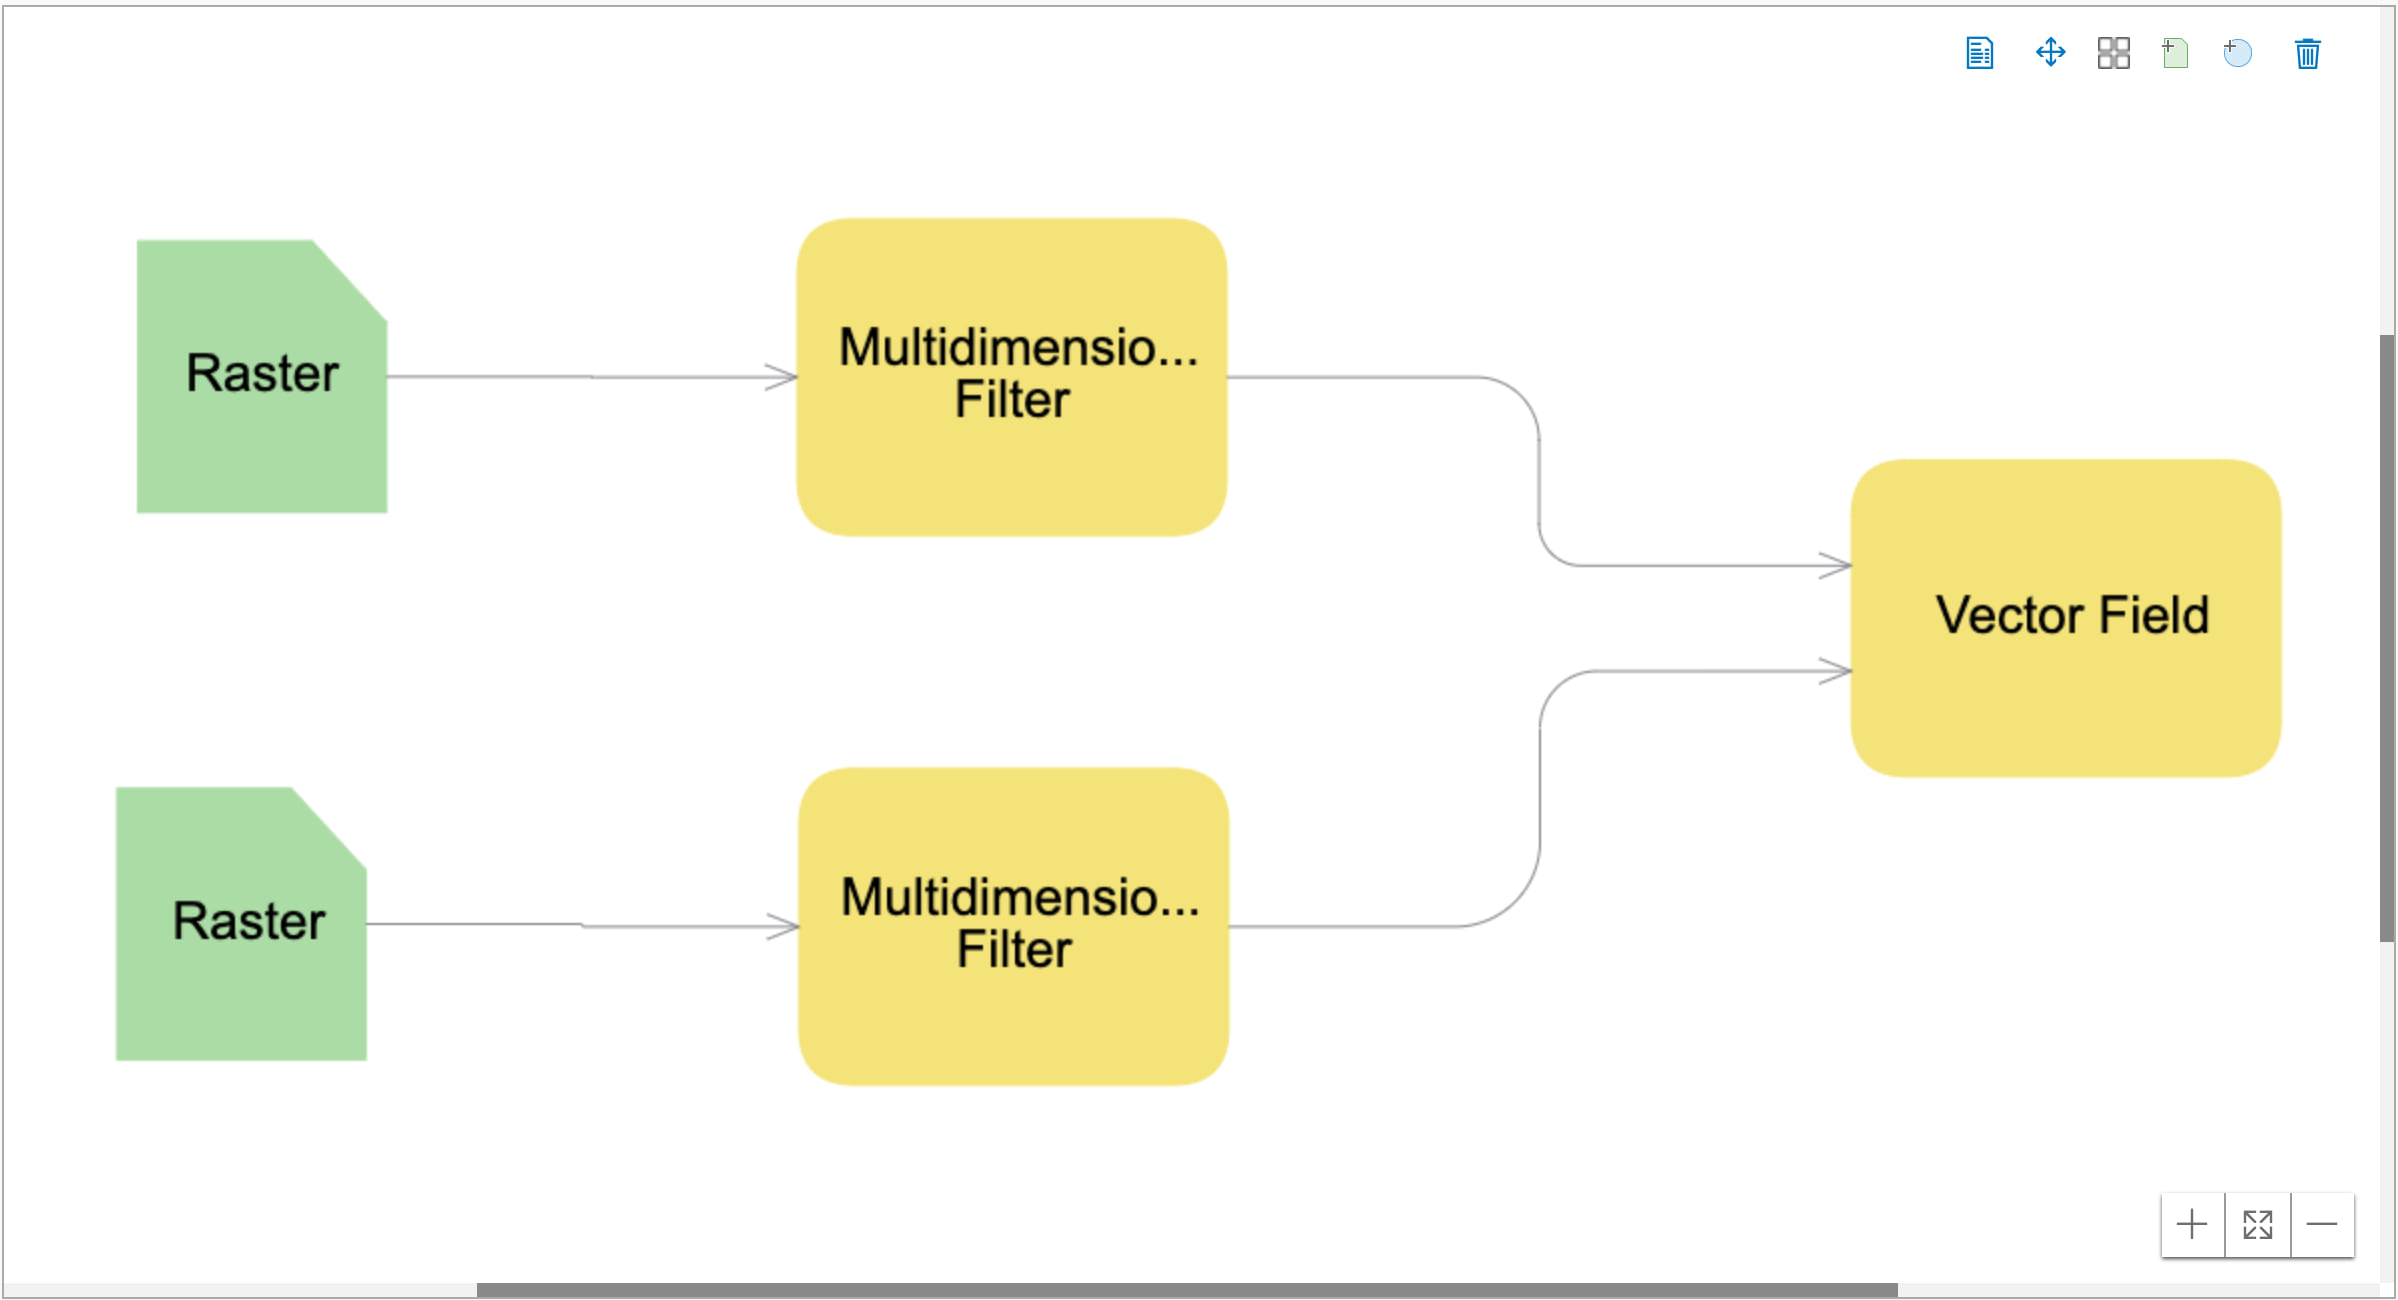
Search for Multidimensional Filter and Vector Field in the panel on the left. We are going to pass each variable (U and V) through a multidimensional filter, then output it as a vector field. In the top right, click the Add Raster Variable button to add two raster variables to your template. Then chain these together, similar to the image below.
You can save the raster function template using the Save As button to allow for easier configuration in the future. Click OK to continue and prepare for raster analysis.
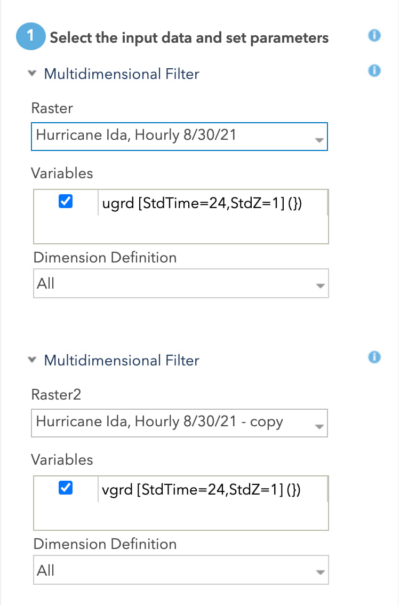
When selecting your input data, point one raster to your original layer and the second raster to your copied layer. This will allow you to select both your ugrd and vgrd variables. If using a dynamic imagery layer, you can use the same layer as your raster both times, but make sure to select a variable representing U or Magnitude for one, and V or Direction for the other.
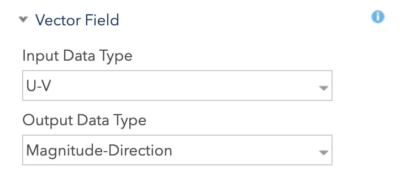
Since we are providing UV variables, I am going to select U-V as my input data type. For my output data type, I will select Magnitude-Direction.
Finally we can give the resulting layer a name, and run the analysis. A new layer will be created with a source type of Vector-MagDir. We can now use this layer with the FlowRenderer in either the Map Viewer or the ArcGIS API for JavaScript.
Step 4: Visualize the data
Flow style in the Map Viewer
From your new layer’s item page, select Open in Map Viewer. You should see the layer displayed in the map with vector field arrows displayed initially. To update the style, click the Styles button (![]() ) in the action bar on the right. This will open a panel of styles to choose from. Select
) in the action bar on the right. This will open a panel of styles to choose from. Select Flow and the layer will update in the map.
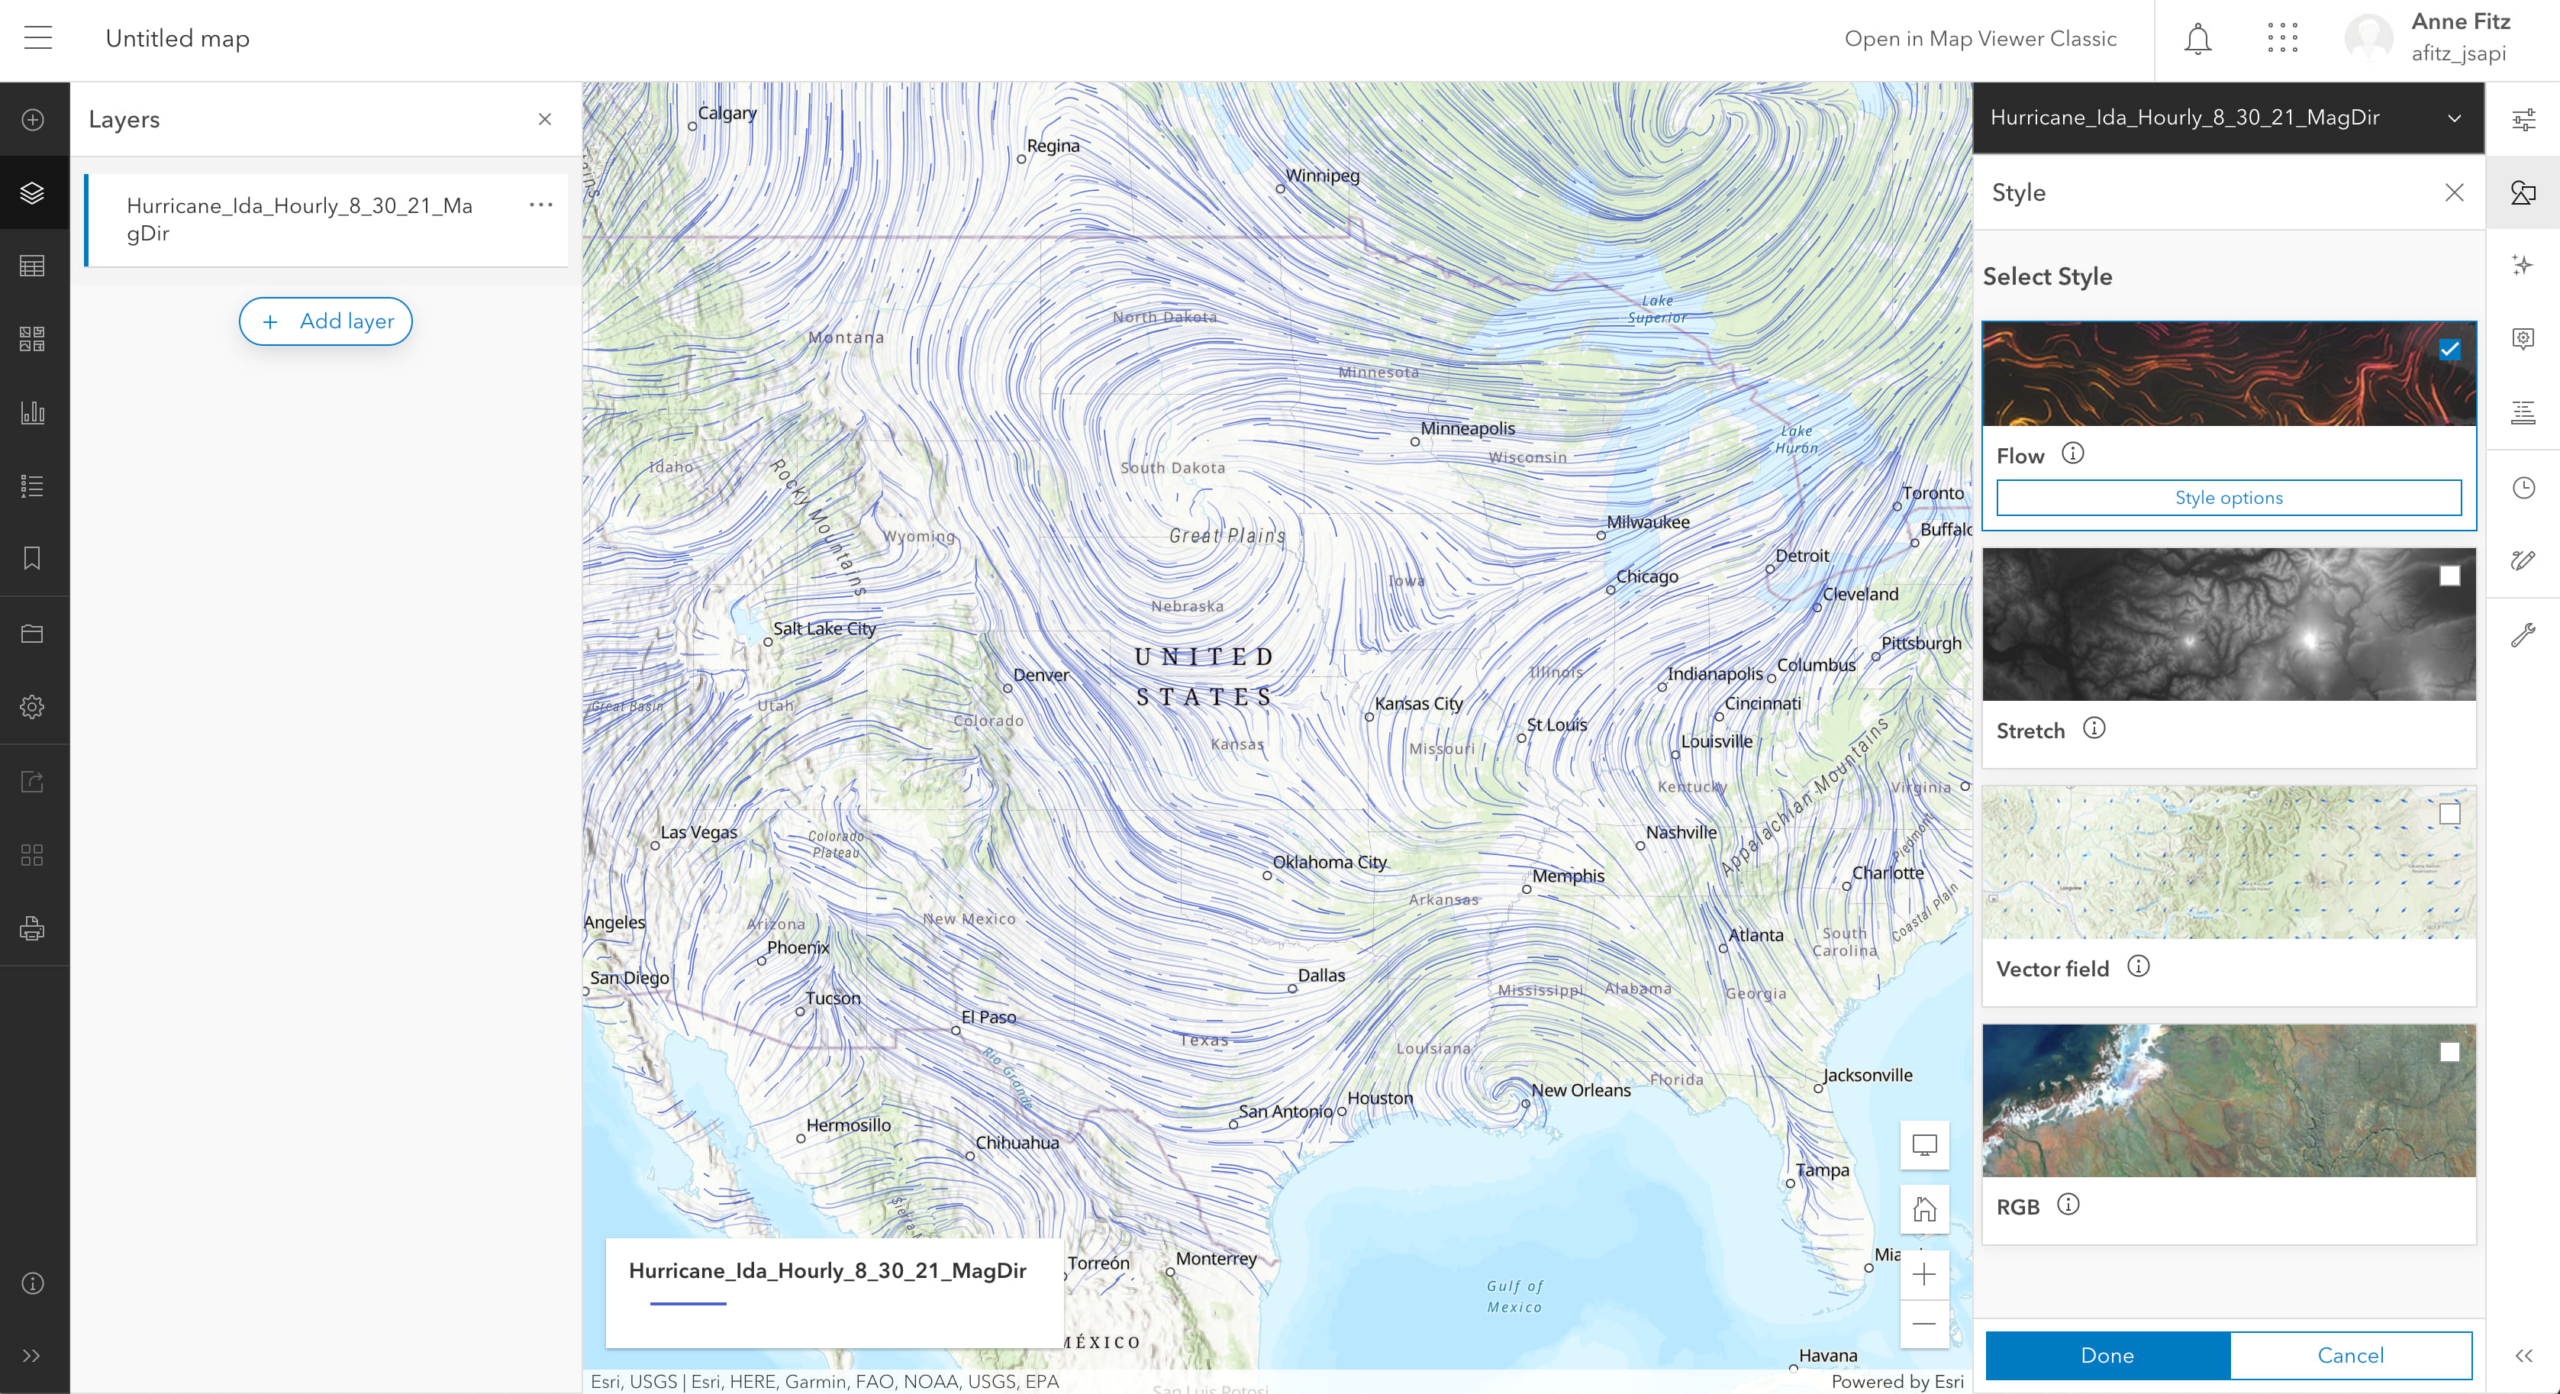
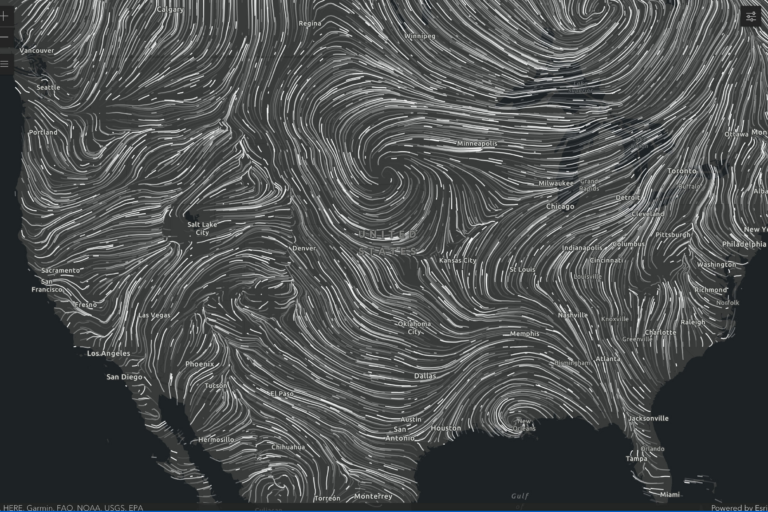
Style options allows you to change the theme, speed, density, length, width, color, and direction of the flow. Play around with these settings and add some layer effects until you have your desired visualization.
You can use the TimeSlider (![]() ) to explore the data at different time slices. When the TimeSlider is not shown, the layer will display data at the first time slice by default.
) to explore the data at different time slices. When the TimeSlider is not shown, the layer will display data at the first time slice by default.
To learn more about the new Flow style in the Map Viewer, check out Map Viewer introduces animated Flow renderer.
FlowRenderer in the ArcGIS API for JavaScript
We can also visualize the layer we created earlier using the FlowRenderer in the ArcGIS API for JavaScript. To do so, we need to load the layer as an ImageryTileLayer, apply the FlowRenderer, and add it to the map.
require(["esri/layers/ImageryTileLayer", "esri/renderers/FlowRenderer"],
  function(ImageryTileLayer, FlowRenderer) {
     let layer = new ImageryTileLayer({
        portalItem: {
          // portal item id can be found in url of item page
          id: "e400c62a545249c4bf80e7fe32b8b3c8",
        },
        renderer: new FlowRenderer()
     });
     map.add(layer);
  });
This will apply the FlowRenderer to the layer with default rendering at the first time slice available in the layer. Use the TimeSlider or update the multidimensionalDefinition of your layer to view the data at a different time slice.
To learn more about the different properties you can set on FlowRenderer, check out this blog post on how to Create an animated flow visualization with the ArcGIS API for JavaScript. There are also a couple of FlowRenderer samples in the JS API documentation where you can learn more. Happy mapping! ?

How can I prepare my own data, e.g. by using ArcGIS Pro? This post only covers downloading external data.
thanks a lot for this useful tutorial, but my question is, is there any other way or workaround for users who have no “ArcGIS Image Extention” ?
Hi Majid, check out this blog on how to Visualize raster using a vector field in ArcGIS. It provides many ways you can prepare your data for visualization in ArcGIS Pro, ArcGIS Online, and ArcGIS Enterprise.