At Esri’s 2023 Developer Summit, I presented web-centric sessions on data visualization and Arcade. Questions that came up following those sessions and multiple times throughout the conference went something like this:
- How can I visualize data from related records?
- When are you going to add support for visualizing data from related records?
- If I can access data from related tables in popups using Arcade, then why can’t I do this for layer styles?
The answer to these questions is the following: You cannot render data residing directly in related tables, and we don’t have immediate plans to support this.
This answer is typically disappointing for people, so I will attempt to demonstrate why rendering data from related records isn’t feasible. Then I’ll suggest how you can use Arcade to pre-process data from related records for visualization purposes.
Rendering geographic data on the web
Before diving into why related records cannot be used for rendering, we should first understand how data is queried from a feature service and delivered to the client before it is prepared for rendering. Feature services hosted in ArcGIS Online and Enterprise are optimized so data is delivered efficiently to the browser once requested.
When you add a layer pointing to a hosted feature service to a map, the browser immediately issues a series of tiled queries to render features in the view. When this happens, the browser requests the data in chunks by dividing the view into a series of tiles, or geographic extents. At least one request is made for each tile.

You can see how this works if you open the network tab in the browser’s developer tools before adding a layer to the map. Once the layer is added, you’ll see a series of requests made by the layer’s view. If you filter the requests using the text query?f=pbf, you will see only tiled requests made to feature services.

The request selected in the image below represents the request for data intersecting the tile highlighted in blue.

When you select a request in the network tab, a window will open providing details about the parameters of the request made to the server. The geometry parameter indicates the extent (xmin, xmax, ymin, ymax) of the tile used to query data. The query parameters in the following image indicate the layer would like the server to fetch all the features that intersect the given extent in multiple requests.

Note the resultType is “tile”. This tells the server the request is repeatable, or cacheable. All public hosted feature services cache tiled requests on the server and CDN. Once cached, every web client that views this layer will use the same query parameters to fetch the features from the cache without having to query the underlying database. Skipping database access decreases latency (i.e. your maps are rocket fast).
The selected tile request responded with a result of 10,747 polygon features. Each of the remaining tiles in the view makes similar requests. Every time the user zooms in/out or pans the map, additional feature tiles are requested, and data is pushed to the rendering engine where it displays the features on the screen.
Fetching data in this manner establishes a balance between issuing queries that don’t request too much data while reducing the total number of network requests.
Requesting data from related tables
A single feature in a feature service layer or table can have many related records. One request must be issued to the server to access related records for a single feature. That means that if I want to visualize data from a related table for the 10,747 features in a single feature tile, the browser would need to issue 10,747 related records requests. That number of requests alone would severely hamper the performance of the web app. Considering additional relationship queries would need to be issued for each map pan and zoom gesture, the user experience would make the app unusable.

How to visualize data from related tables
Only data containing feature geometry can be viewed on a map. To visualize data from related records you must summarize the data in the layer’s fields. The layer can have fields that summarize data from related records in the following ways:
- The count of records related to the feature
- The sum, average, min, or max of a data value for all records related to the feature,
- Any data attribute of the most recently added feature to the related table.
You can summarize all of this information in the main table of a Feature Layer using a number of methods:
- Leverage the Join Features analysis tool to join data from related records to a hosted feature layer view.
- Use the ArcGIS API for Python to request related records and update summary layer fields using either edit or append.
- Calculate fields summarizing related data using Arcade.
I’ll spend the remainder of this post describing how you can use Arcade to summarize data from related tables in the layer so you can use it for rendering.
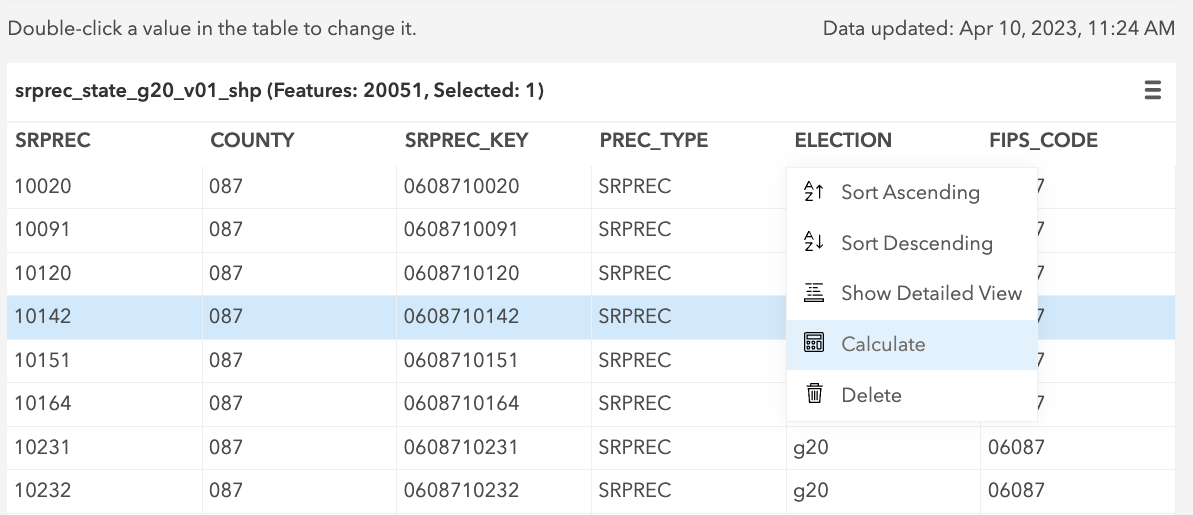
Calculate layer fields from related records using Arcade
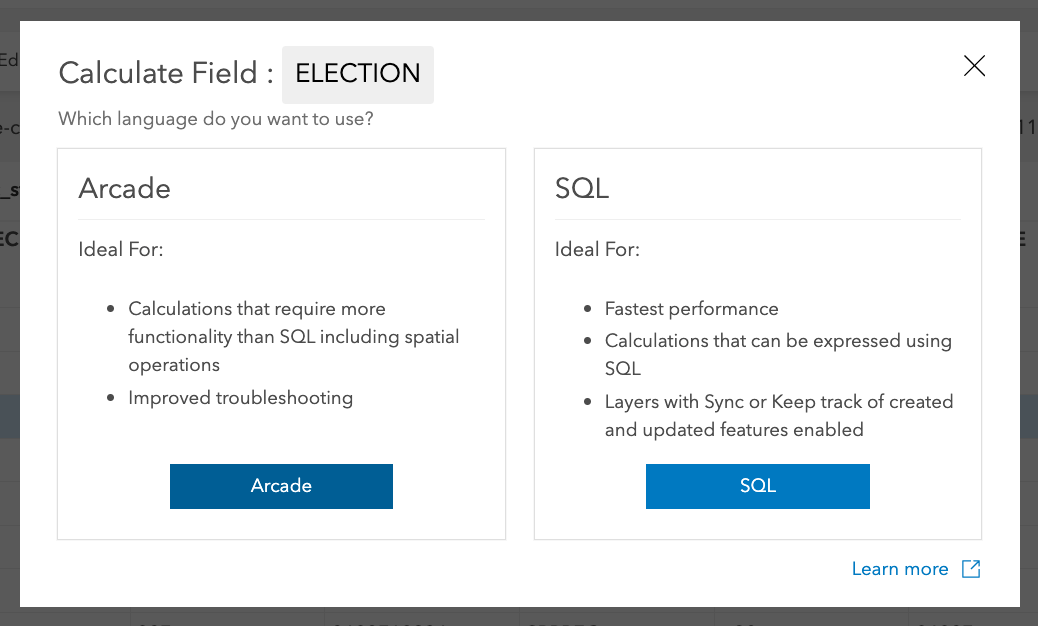
To calculate new values for a layer’s field, click the field name in the feature table in the item’s data tab and select Calculate.
Then select the Arcade option.
You can now author an Arcade expression to calculate a value within the Arcade editor component. The FeatureSetByRelationshipName Arcade function allows you to query a feature’s related records. It returns a FeatureSet, or collection of features, representing all records related to the input feature. You can then use any other Arcade functions to process these records.
Returning the related records in the expression and clicking the Run button allows you to view all related records for a test feature while you author your calculation expression.

The following scenarios will demonstrate how you can use Arcade to calculate field values that may be used to visualize data from related records.
Scenario 1: Record Count
To return the count of related records, simply pass the related records FeatureSet to the Count function.

Once the field is calculated, you can access it in the layer’s renderer or the Change Style panel in ArcGIS Online or ArcGIS Enterprise portal. This also applies to the remaining scenarios.
Scenario 2: Average
The following expression demonstrates how to calculate the average value of a numeric field in related records. In this case, a related table contains information about broadband providers in a geographic area. This expression calculates the average download speed between the various providers using the Average function.

Scenario 3: Max
You may want to visualize the maximum available broadband speed in an area. The following expression returns the maximum available broadband download speed using the Max function.

Scenario 4: Custom values
You can also leverage other Arcade functions to calculate custom statistics from data in multiple fields. This expression uses the Filter function to calculate the percentage of providers that offer download speeds slower than 25Mbps.

Scenario 5: Data from the most recent record
Arcade also allows you to find the most recent record in a related table and return a data value from it. To do this, use OrderBy to sort the FeatureSet in descending order based on a date field. Then select the first record and access its attributes.

Example: Broadband availability
The ArcGIS Living Atlas of the World provides a couple of datasets that serve as good examples for summarizing key values from related records to use for rendering and popups.
- FCC Form 477 Fixed Broadband Deployment Summary by Census Block with Provider Data – This service summarizes Federal Communication Commission (FCC) Form 477, which contains broadband data by transmission technology and download and upload speeds. Each layer represents a level of geography that summarizes data from related tables. View the item’s data tab to explore how the data is structured.
- FCC Broadband Data Collection – This layer summarizes the number of served, underserved, and unserved Broadband Serviceable Locations (BSLs), also based on related tables.

Conclusion
Can you render data from related records? Yes and no. You can’t in the sense that you cannot directly access data in related tables at runtime for rendering purposes. The sheer number of queries required for data to render in the view would cripple the application.
However, you can preprocess data from related records by using Arcade to calculate fields in the layer summarizing the data you wish to visualize. In short, the data must be structured so it can be queried performantly by the JavaScript Maps SDK’s rendering engine.
While Arcade provides helpful functions for calculating fields based on data in related records, it isn’t ideal for scenarios where you have a lot of data to update or the data needs to update frequently. In these scenarios, consider using one of the other methods for summarizing data from related records mentioned above.


Article Discussion: