In this blog, you will learn about how changes in your utility network or trace network can impact existing network diagrams or affect the creation of network diagrams. You will also learn how to navigate various scenarios that you may find yourself in as a result of these changes.
_____________________________
Introduction
We will start with reminders about network diagram main concepts—What is a network diagram and a diagram template? What are diagram rules? How are diagram rules applied during the diagram build process? What are diagram extents?
We will then discuss utility and trace network changes—What operations modify the network editing and topology spaces? What are dirty areas and errors? What does network topology validation mean?
Finally, we will explain how and why these changes impact network diagram user workflow—What does it mean for a network diagram to be inconsistent with the network editing or network topology space? How and when can an inconsistent network diagram get back into a consistent state? How much do these changes modify existing diagrams or affect the creation of new diagrams?
_____________________________
Network diagrams main concepts
Before getting to the heart of the matter, let’s review the main concepts for network diagrams.
What is a network diagram?
Network diagrams are representations of a set of network features and network objects that participate in a utility or trace network. They contain diagram junctions, edges, and containers that are related to network features and objects.
Note: To simplify, we’ll use the term ‘network features’ instead of ‘network features and objects’ in the rest of the blog.
When we create a network diagram, we specify some input network features from which we want to create your diagram. Then, we choose the diagram template on which this diagram will be based.
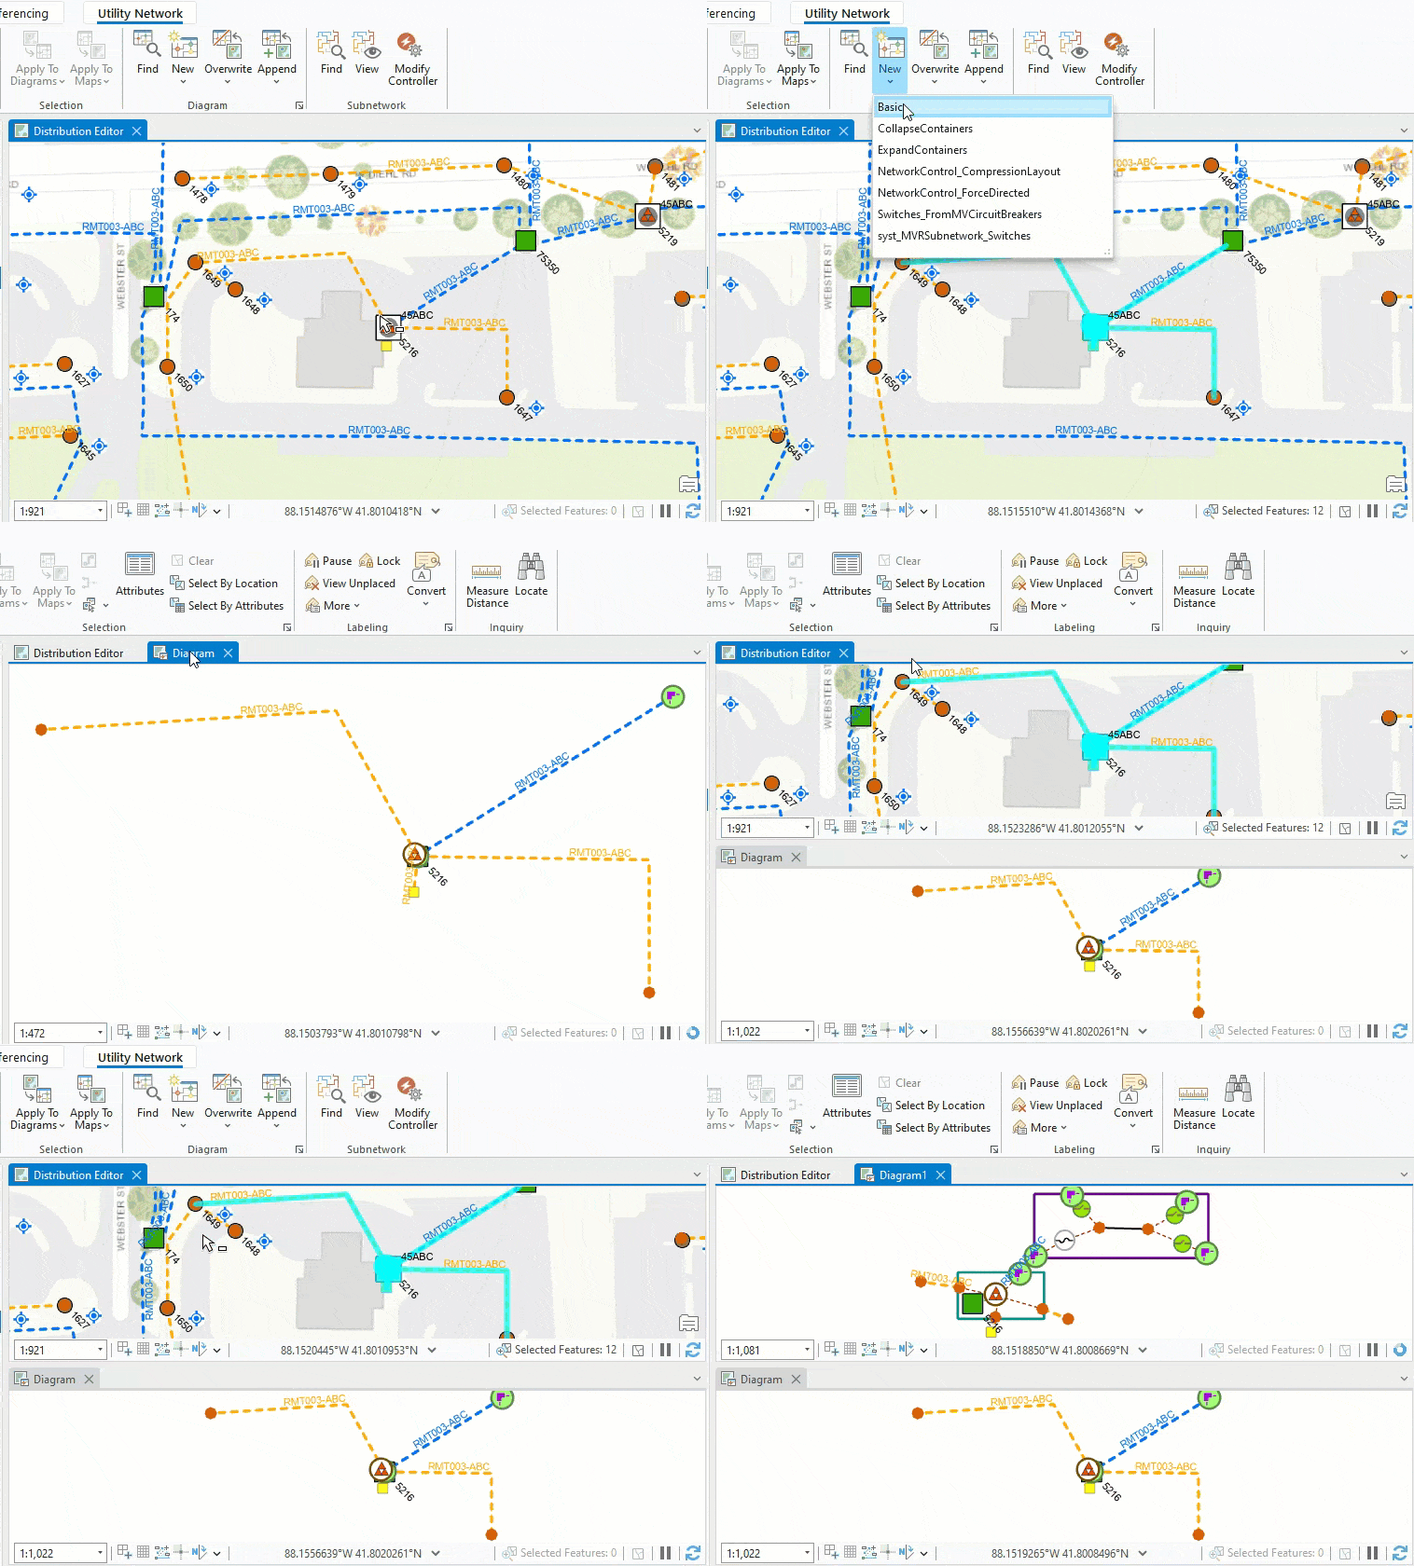
Diagram templates and diagram rules
A diagram template defines the diagram rules and layouts that are used to build any network diagrams based on this template.
A diagram rule is a specific task that changes the diagram graph managed in memory during diagram generation and update.
You can configure various types of rules on a diagram template. The following are common examples:
- Rules to discard certain network features
- Rules to add extra network features using connectivity
- Rules to reduce network points or collapse network containers.
Diagram templates often contain many diagram rules. Each rule runs sequentially to iteratively build the final diagram graph. This means that the first rule applies to the initial diagram features. The second rule will apply to features returned by the first rule, and so on. The features that result from the last rule in the template are output as the diagram features. The following graphic shows this process.
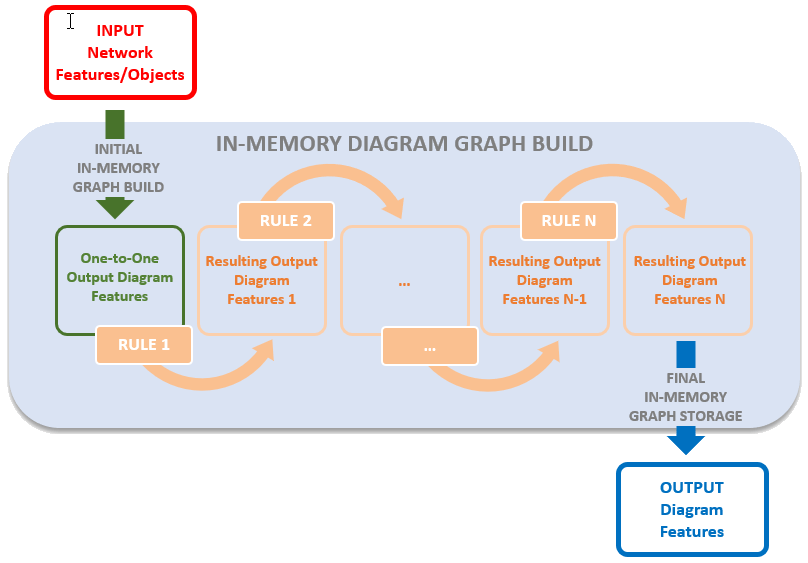
Network diagram build process
Let’s review the network diagram creation and update processes by examining a sample diagram template. Imagine a diagram template configured for an electric utility network to create simplified diagrams for the features downstream from each medium voltage switch selected as input. The diagram template would contain a diagram rule sequence close to the following:
- A diagram rule to set starting points on any medium voltage switches among the network features selected as input
- A trace rule to run a downstream trace from each starting point
- Collapse container rules to collapse most of the containers returned in the resulting downstream traces
- Reduce junction rules to reduce some non-relevant network junctions along the downstream traces
Sample diagram creation
To generate a diagram based on this sample diagram template, we select medium voltage switches as input, and select this diagram template from the New template list. Then, each of the rules detailed in the previous section applies as the diagram graph is built in-memory. Once the rule sequence completes, the network diagram only shows relevant network features along the downstream traces related to the input switches.
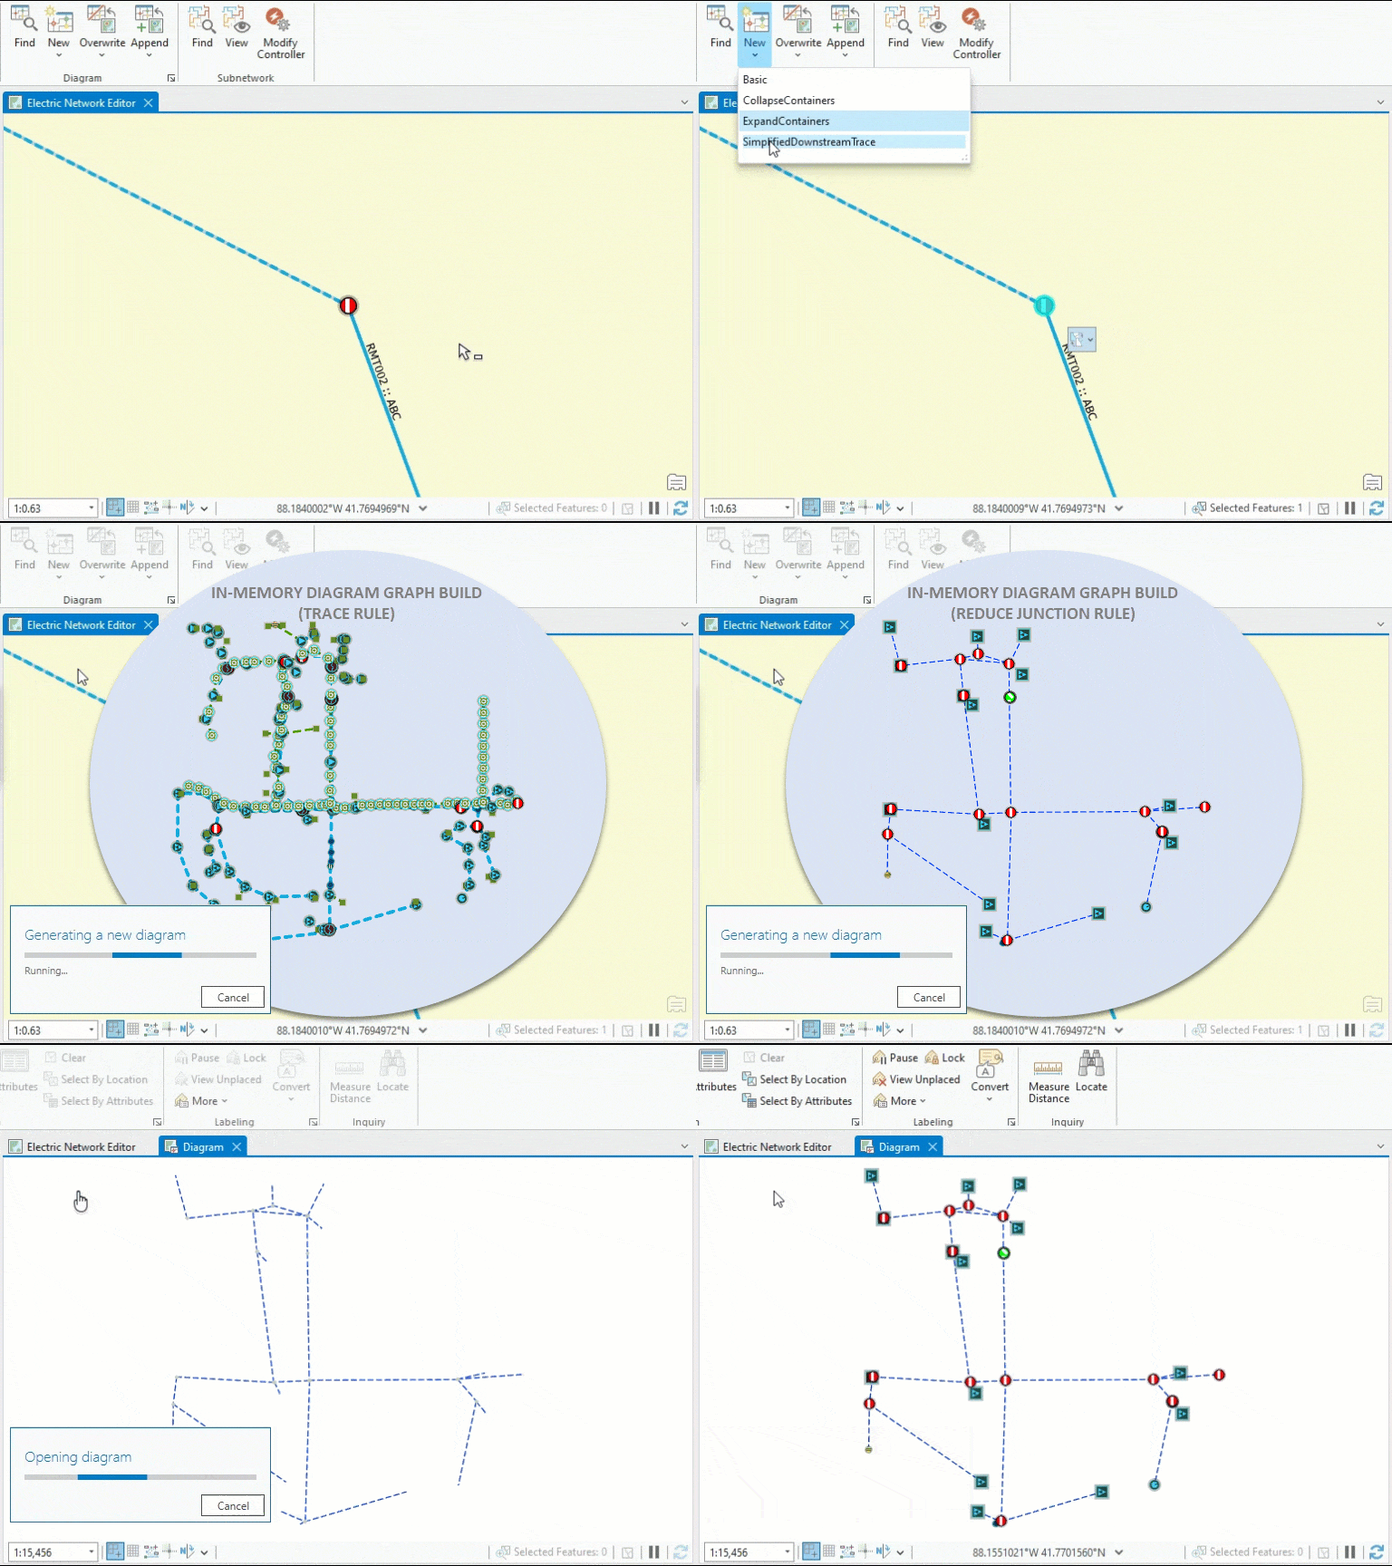
Sample diagram update
Updating a network diagram refers to synchronizing its content with the network features used to initially generate it and reflecting any changes that may have impacted those network features in the diagram. This is most commonly performed after network topology validation.
The update process is very close to the generation process. In the case of our simplified downstream trace diagram template, it starts by retrieving the initial switches in the utility network and then rerunning the rules specified on the template so the updated diagram reflects potential changes that can have impacted the network since the diagram creation or its last update.
Network diagram extents
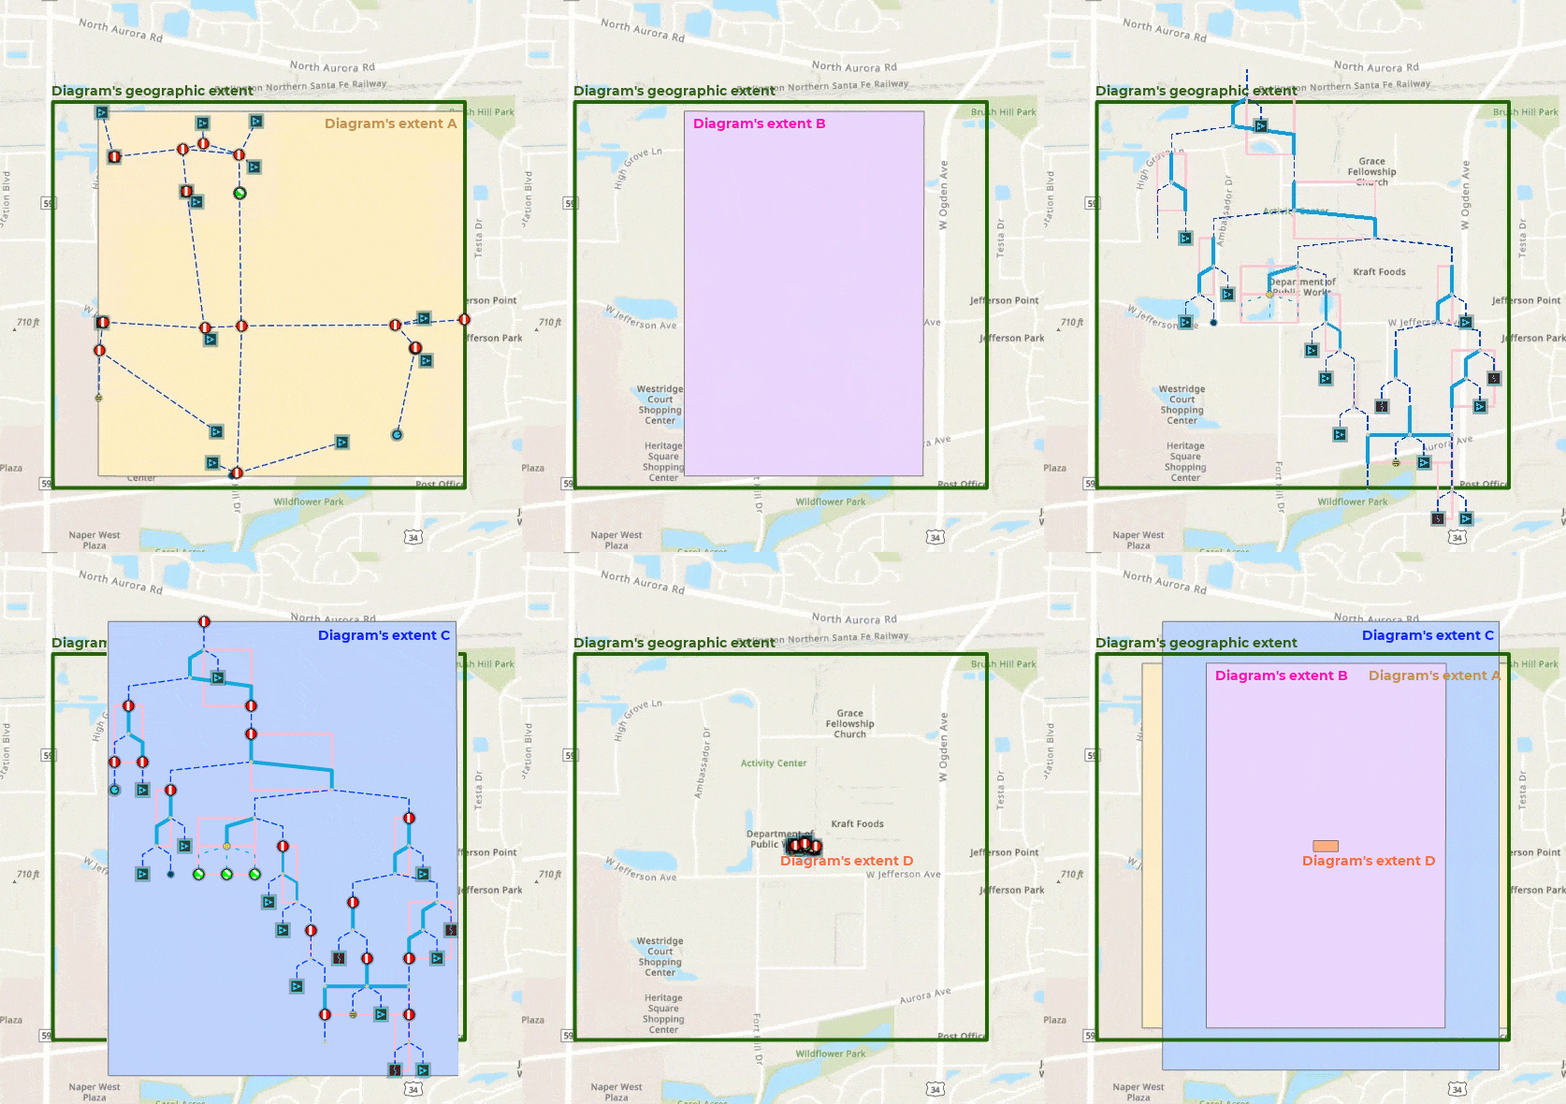
For each network diagram, we manage and store two kinds of extents—the diagram’s geographic extent and diagram’s extent.
- The diagram’s geographic extent corresponds to the extent of all the network features included in the network diagram. This includes features that may have been reduced or collapsed by rules in the diagram template.
- The diagram’s extent is based entirely on the diagram feature locations in the network diagram.
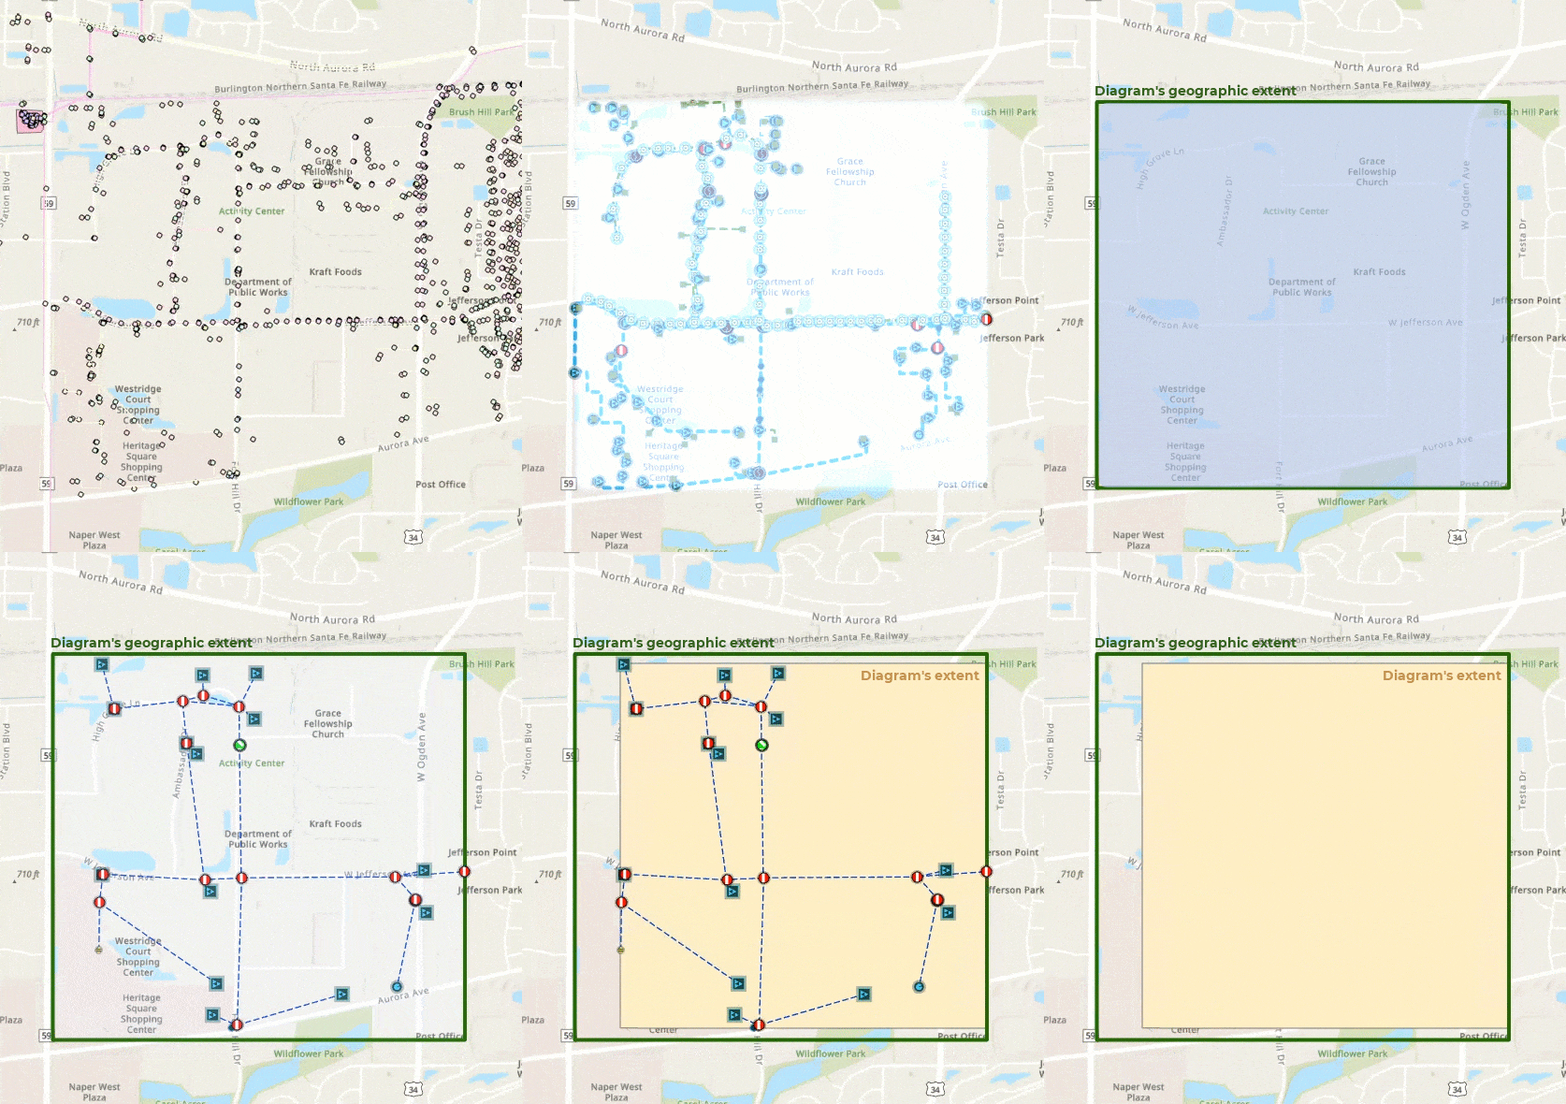
Updating a network diagram, overwriting its content, appending network features to a network diagram can modify both the diagram’s extent and diagram’s geographic extent.
While changes to the layout of diagram features can change the diagram’s extent, they can never affect the diagram’s geographic extent.
_____________________________
Utility or trace network space changes
The utility or trace network editing space changes each time we perform one of the following tasks:
- Moving or modifying a network feature
- Creating or deleting a network feature
- Creating or deleting connectivity, containment or structural attachment associations
- Editing attributes on a network feature
Dirty areas on network features
Any change on the network editing space creates a dirty area in the network map around the impacted utility or trace network feature locations. These dirty areas mark any modified features in a map to indicate that the network topology space does not match these edited features.

Network topology validation
The network topology manages information about the network and maintains the connectivity between network elements. The network topology must be validated to clear dirty areas and include changes on the network editing space in the network topology space.
The validation process runs on a given geographic extent.
Utility or trace network errors
Errors are produced during network topology validation when edits on the utility or trace network violate restrictions or network rules or creates invalid situations.
_____________________________
Impacts on network diagram workflows
The next sections explain how these network changes impact our network diagrams and their contents during usual workflows.
Diagram consistency state
There are various diagram consistency states. In this blog, we are focused on the diagram consistency states that are related to network space changes only.
For a complete knowledge of the various network diagram consistency states, see Network diagram consistency.
Introducing consistency states related to network space changes
Diagram consistency states related to network space changes concern changes on the network editing space or on the network topology space.
- When there are dirty areas in the network that impact features of the diagram, the network diagram is inconsistent with the network editing space. A red warning icon
 displays next to the diagram layer in the Contents pane.
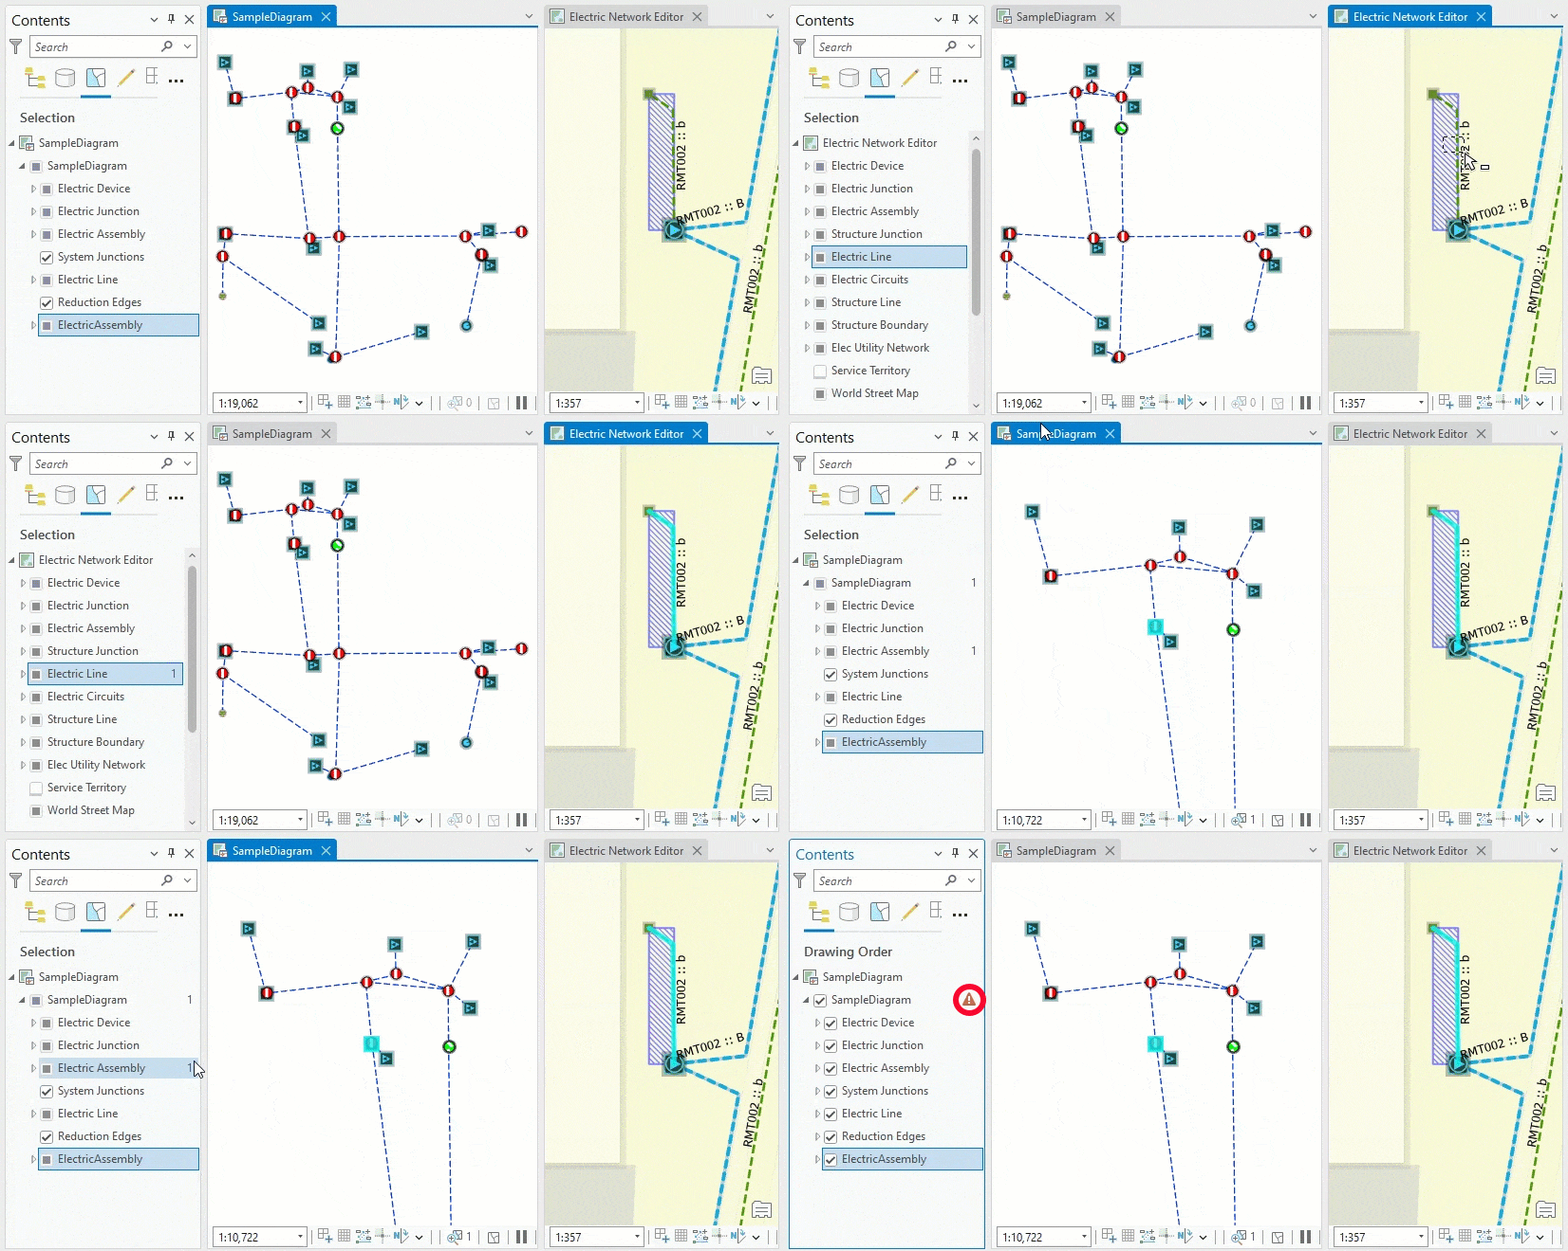
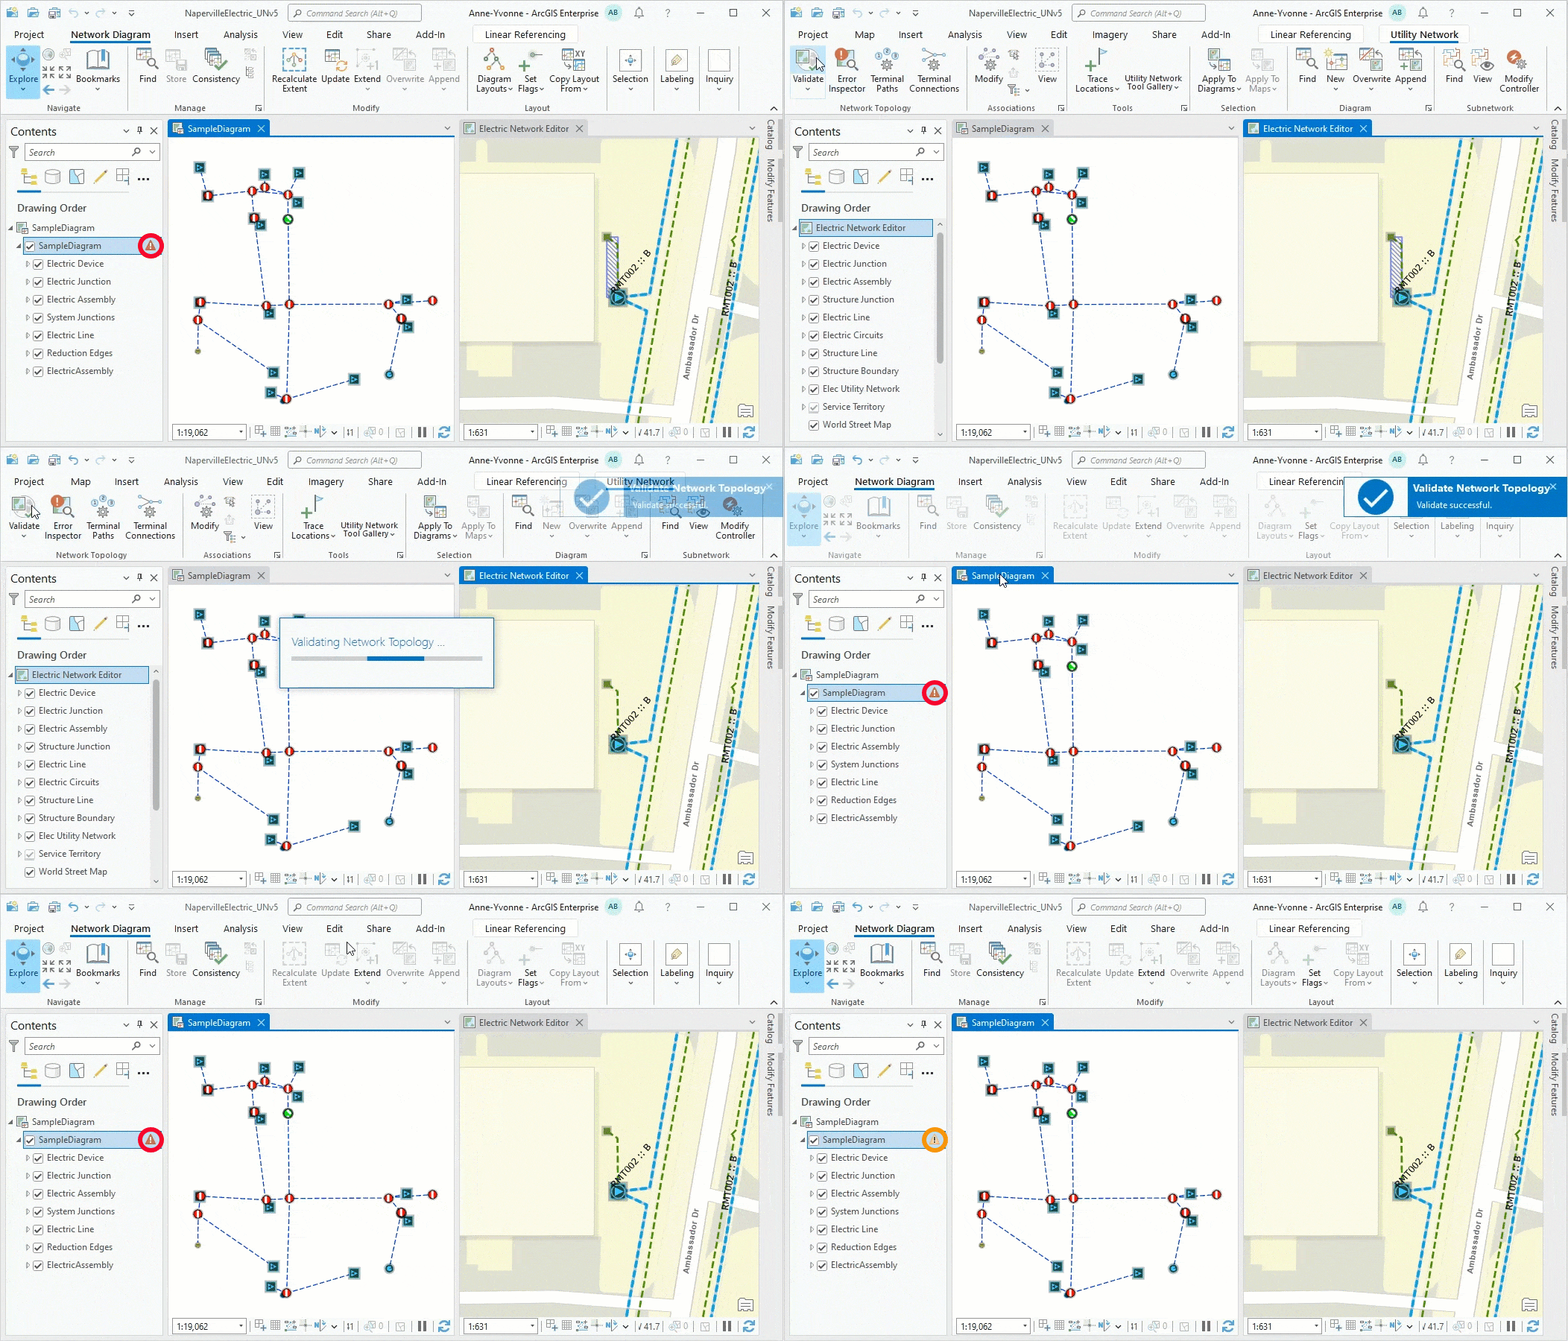
- When the network topology has been successfully validated for an extent that intersects the diagram’s geographic extent, the diagram is inconsistent with the network topology space. In this situation, you will see an orange warning icon
 next to the diagram layer.
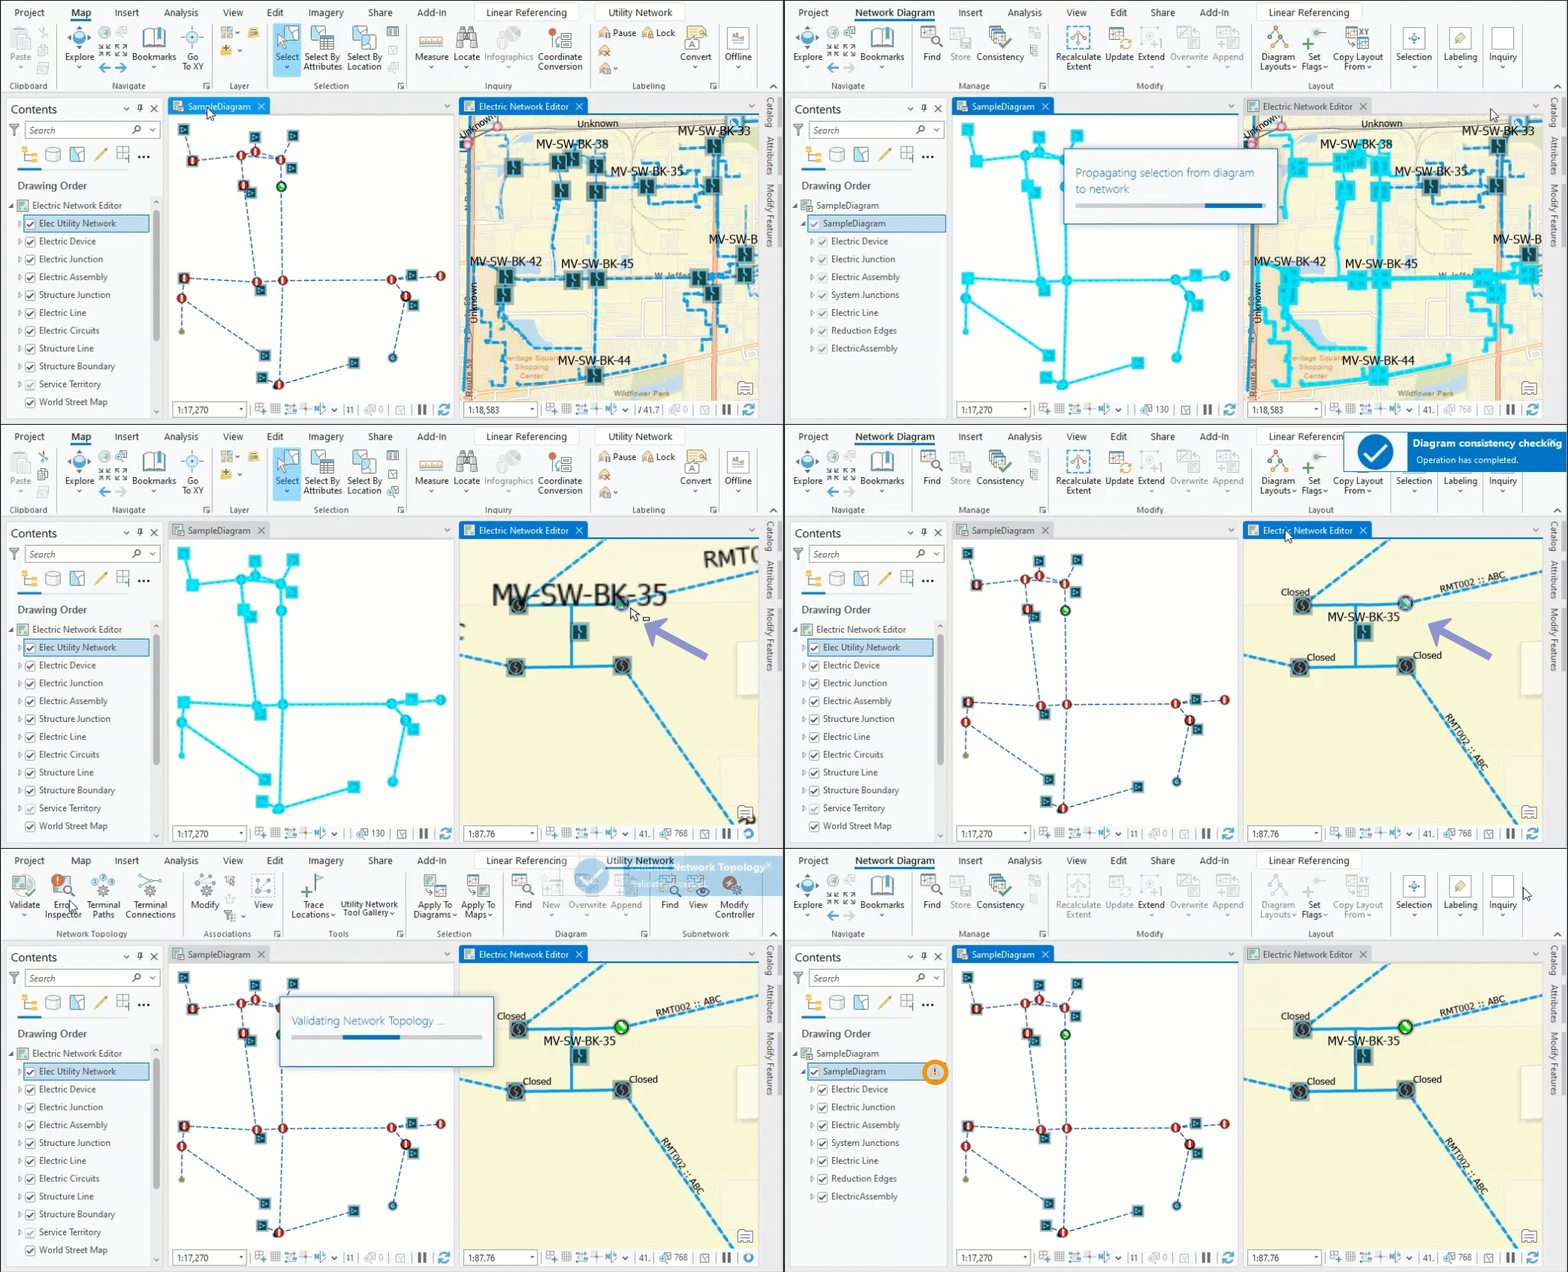
Any network diagram for which the geographic extent intersects a newly validated network area becomes inconsistent at the time the validation process completes. This is true even if the validated network features are not part of the diagram as outlined in the next video:
Network diagram consistency state cycle
The following graphic illustrates the network diagram consistency state cycle.
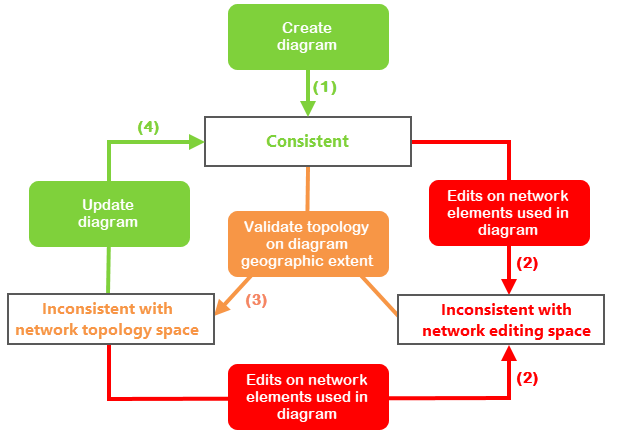
When a network diagram is first created it is consistent with both the network editing space and network topology space (1). However, the diagram can become inconsistent following edits on the network space (2) or network topology validation (3).
For a diagram inconsistent with the network editing space, you must validate the network topology on the diagram’s geographic extent. Once the network topology validation succeeds (3), the network diagram becomes inconsistent with the network topology space.
When a diagram is inconsistent with the network topology space and you want to get back to a consistent diagram, you can update the diagram. Any network diagram is consistent with both the network editing space and network topology space once its update successfully completes (4).
Diagram build process crossing dirty areas or errors
The network diagram generation and update process will fail if the build process finds any dirty areas or errors on network features that are going to be included in the new or updated diagram.
Let’s use an example for network diagrams based on our sample SimplifiedDownstreamTrace diagram template explained above. To complete successfully, the network diagram creation and update processes require the following two conditions:
- There is no dirty area or error features on any input medium voltage switches.
- There is no dirty area or error features on the network features that are returned by the downstream trace run during the diagram build process.
Diagrams including deleted network features
The network diagram layer is a composite layer under which each sublayer includes a join between the diagram feature class and the related network source class or table.
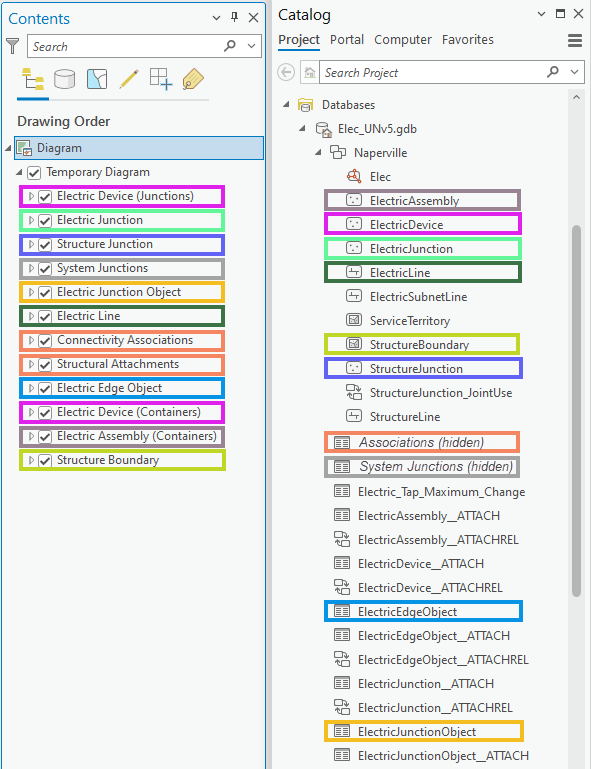
Due to these joins, any network feature represented in a network diagram disappears from the diagram at the time it is deleted in the network even before network topology validation.
However, after such a deletion, the diagram requires an update, at least to return to a consistent state and review diagram statistics.
There are deletions on some specific network features that can make the diagram update process fail. For example, with a diagram based on our sample SimplifiedDownstreamTrace template, the update process returns an error after deleting all the medium voltage switches used as input for the diagram generation. In this case, the failure happens when the Set Starting Point rule is performed. This rule expects medium voltage switches to process. Since such a medium voltage switch no longer exists, the diagram update cannot be run.
Diagrams including network features with attribute changes
Attribute changes that impact network features can make an existing diagram become inconsistent. However, when these changes don’t apply to network attributes, they usually have no significant impact on the network diagram even after an update.
If the edits change attributes whose values are used to symbolize or label the diagram features, the changes are immediately reflected in the diagram even before the network topology validation and diagram update. Again, this is due to the joins on the diagram sublayers.
However, you may see significant impacts on existing diagrams when the edits apply to network attributes and the diagram build performs a trace rule.
For example, let’s analyze how the opening or closure of a switch can impact the update of diagrams based on our sample SimplifiedDownstreamTrace template:
- The downstream trace performed during an update can return a shorter or larger set of traced network features. This causes the updated diagram extents to be shortened or widened and diagram feature counts to decrease and increase.
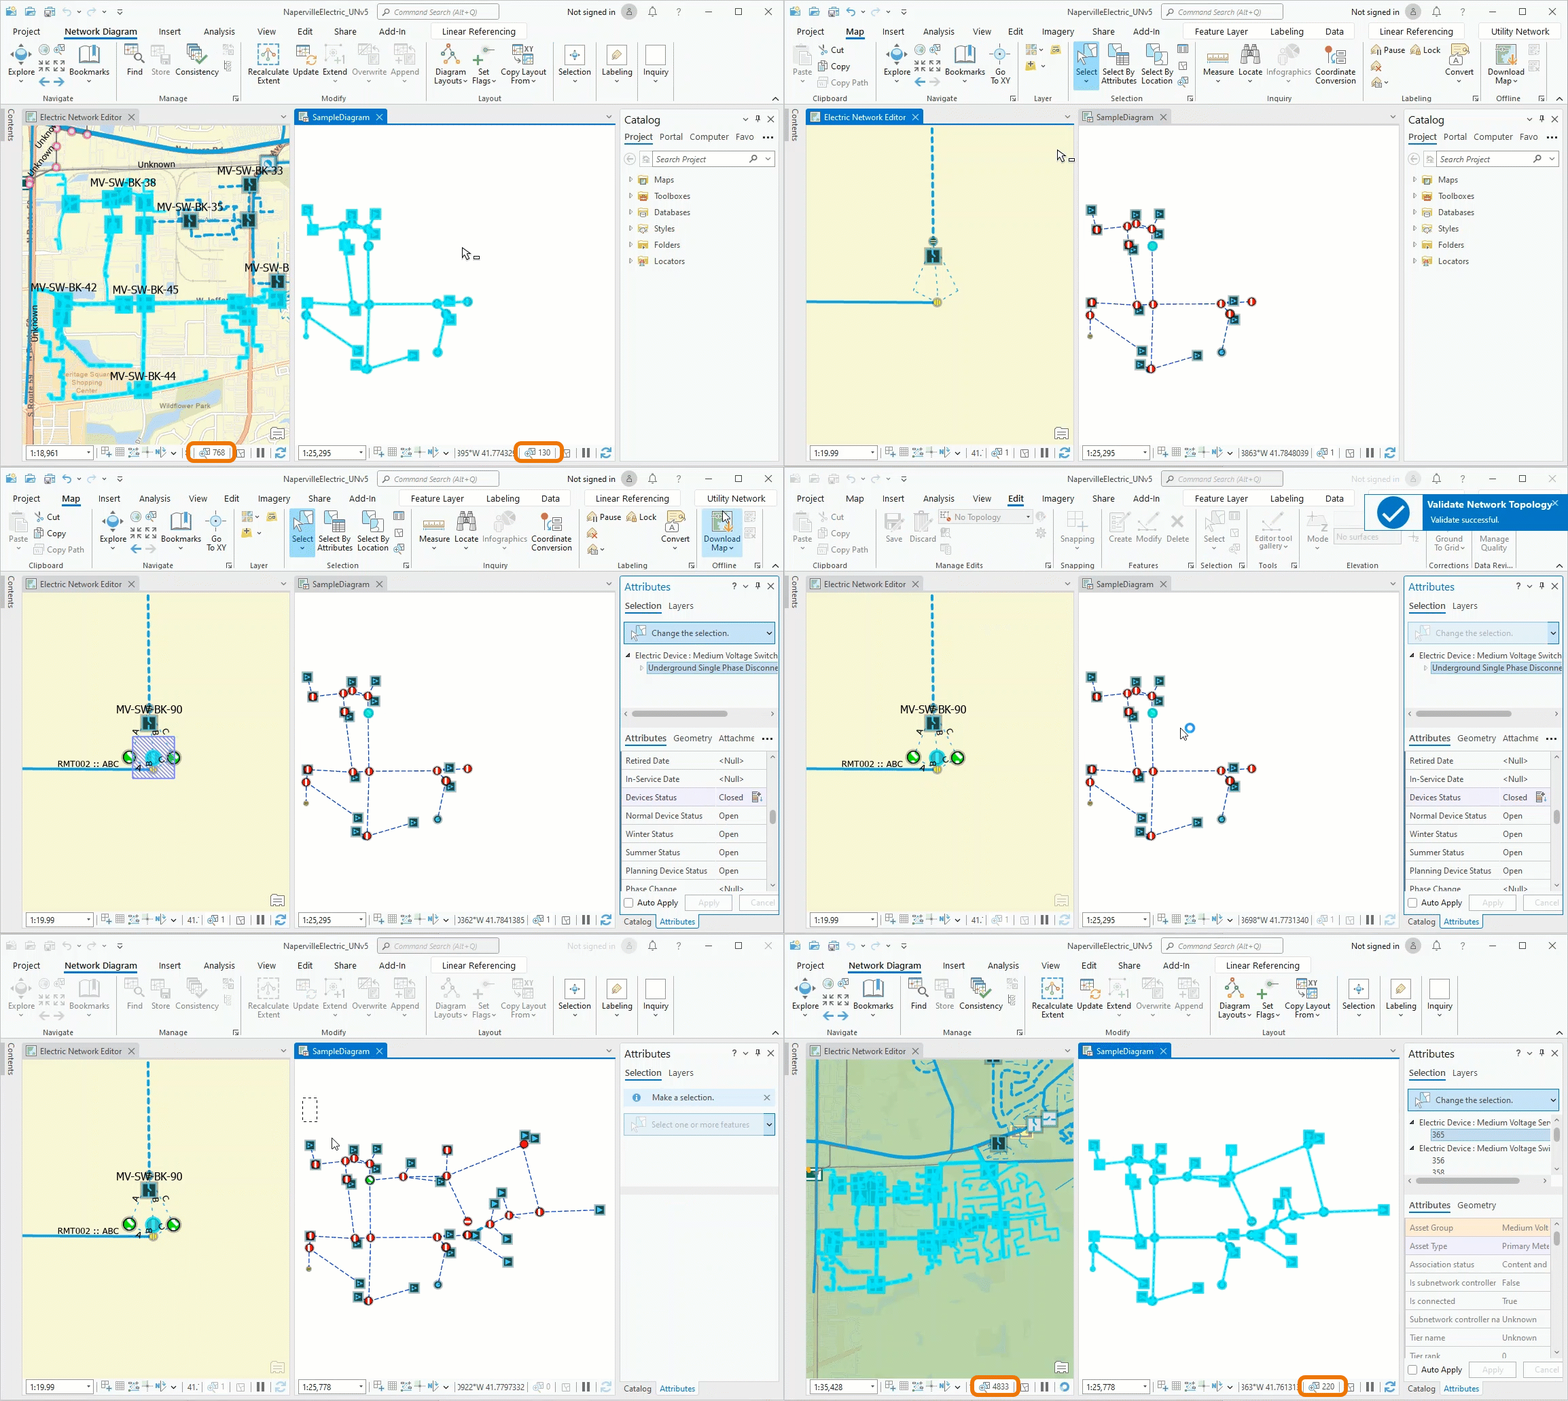
- Any new diagram feature added to the updated diagram displays at its geographic location by default. Depending on the diagram layout before update, these new diagram features can display far away from the diagram features that already exist in the diagram since those diagram features preserve their positions after an update.
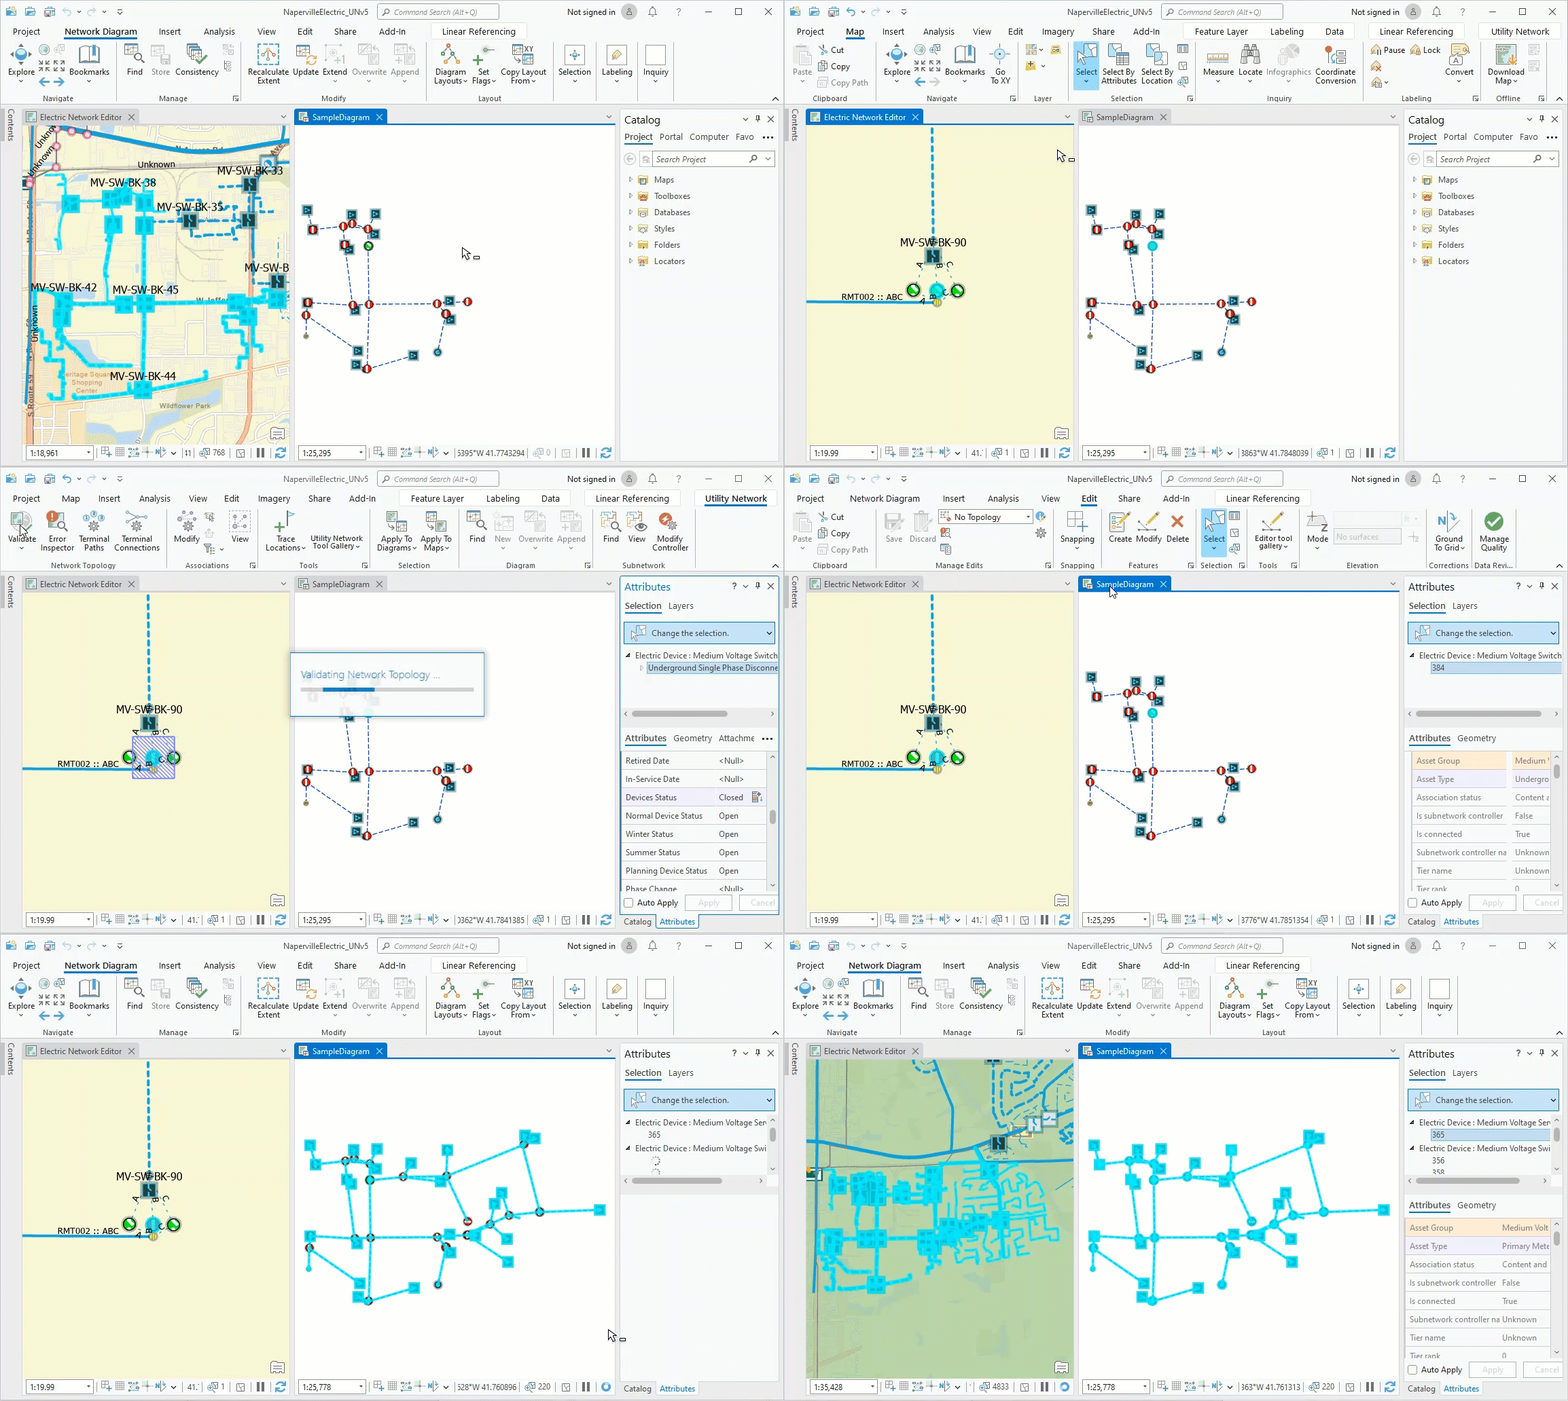
- The update process can encounter dirty areas or errors that are currently out of the diagram’s geographic extent and prevent the update from properly completing.
_____________________________
Conclusion
We hope this blog post helped you better understand how network diagrams work and how changes on utility or trace network can impact them. In a future blog, we will go into detail about the management of layer properties under the network diagram layer.


Article Discussion: