This post is part of a series for ArcGIS Pro users that are interested in Python but do not have programming experience. If you haven’t yet, check out the first two posts: an introduction and an overview of learning resources. This introductory ArcGIS Pro Python tutorial is designed for beginners to get their feet wet with the Python window and geoprocessing functions. I’ll draw attention to some basic concepts to explain what the code is doing, but note that it’s not a comprehensive introduction, and if it’s your first time, you’ll probably have some unanswered question. This is why I recommend you use other resources to get a solid foundation of Python knowledge from experts.
A brief tour of the Python window
In this workflow, you’ll learn to run some geoprocessing tools from the Python window. The Python window is one of two environments you’re most likely to use as you start working with Python and Pro (the other is an Integrated Development Environment or IDE, which we’ll explore in a coming post). In the Python window, you can easily run small bits of code and get immediate feedback on a map. This makes it great for experimentation, as well as small workflows like the one we’ll walk through here.
Protecting schools from rogue zoo animals
In this very fictional scenario, you’re a GIS analyst for the city of Redlands, California. There’s a bit of a crisis: a group of troublemakers broke into the Redlands Zoo last night and opened several different enclosures. Potentially dangerous animals are now roaming around town.

Local law mandates that any school within 1 kilometer of a confirmed zoo animal sighting must go into lockdown (in this version of reality, Redlands both has a zoo and is one of the few places in the US forward-thinking enough to use the metric system). You just received some data collected by two fieldworkers, Jimmy and Lola, detailing recent sightings. Since you might receive more datasets as the day goes on, you decide to automate your analysis.
You plan to use two geoprocessing tools for this analysis: Buffer to get a visualization of a 1-kilometer radius around each field sighting and Select Layer By Location to identify schools that intersect the buffer zones. You’ll apply these tools to multiple feature classes in the Python window.
- Begin by downloading the project package. From the ArcGIS Pro start page, under your list of recent projects, choose Open another project. On the Open Project dialog box, under Portal, click ArcGIS Online. Then, search for “Zoo Escape Python Tutorial.”

- Double click the resulting package. If multiple results appear, choose the package with ArcGISProTutorials as the owner.
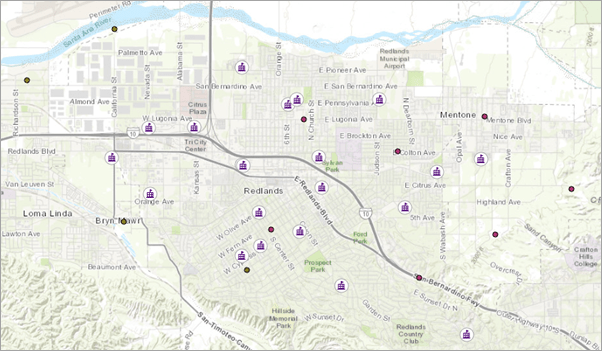
When the project opens, you’ll see a map containing three point feature classes: field sightings from Jimmy, field sightings from Lola, and local schools.
- Click the View tab on the ribbon. In the Windows group, click Python. The Python window opens. It has two components: the transcript and the prompt.

In order to perform the same geoprocessing tasks on multiple feature classes, you’ll need to create lists. The list is one of Python’s common data types. It’s an ordered sequence of items contained in square brackets [ ] and separated by commas. You’ll assign your lists to variables—basically, this gives them names that you can call them by.
- In the Python window prompt, type the following-
fcList = ["FieldSightings_Lola", "FieldSightings_Jimmy"]
- Press Enter.
The line of code moves up into the transcript. There’s not much feedback from assigning this variable. You can check to make sure you created the list successfully by printing it. Type the following and press Enter-
print(fcList)

Next, you’ll create a second, empty list. Lists are mutable, meaning you can add, delete, or modify the items they contain. When you run the Buffer tool in the next step, you’ll use this empty list to store the names of your outputs.
- In the prompt, type-
buffList = []
Press Enter. Now you’re ready to buffer your list of feature classes. To do this, you’ll use a for loop. Loops are a critical part of automating repetitive tasks in Python. The code contained in the loop is repeated over a sequence. In this case, you’ll buffer each item in fcList.
- Type the following into the prompt (remember the colon at the end!)-
for fc in fcList:
Press Enter. The line you just typed will stay in the prompt, and your cursor will jump down to the next line, automatically indented (all indented lines under the header are part of the loop). Type:
buff = arcpy.Buffer_analysis(fc,fc+"_Buffer","1 kilometer")
arcpy.Buffer_analysis is the ArcPy function for the Buffer geoprocessing tool (you can find this out by reading the help for Buffer). The parameters, which you usually fill out on the Geoprocessing pane, are instead typed inside parentheses. Notice as you type that a screen tip notes the parameter you should specify next.

Let’s walk through what you have so far (don’t press Enter yet!).

fc is a new variable, which gets re-assigned to each item in fclist (i.e., our two feature classes of animal sightings). It is then used as the input feature class for the Buffer tool. fc + “_Buffer” is the output feature class name. This means the resulting feature class will have the same name as the input feature class, plus the suffix _Buffer, for example, FieldSightings_Lola_Buffer. The buffer distance is 1 kilometer. You use another new variable, buff, to store our output for the next step in the loop, which will add it to the empty buffList. You’ll add that step now.
- Press Enter again. You’ll still be inside the loop in the prompt. Type-
buffList.append(buff)

- Press Enter twice to finish the loop and run the code. Behind the scenes, Python is running the indented parts of the loop over the two items in
fcList. When it’s done, buffers will appear on the map around all field sightings.
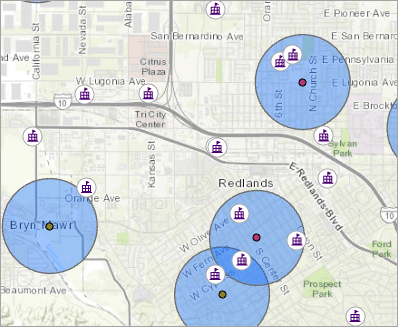
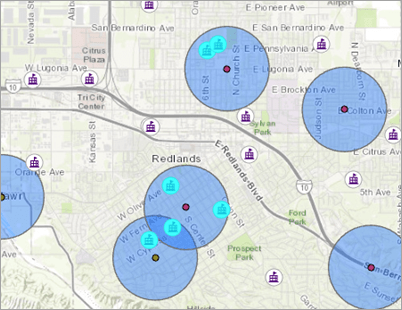
This visualization gives you a nice overview of the area within a 1-km radius of zoo animal sightings, which you could share with local authorities for reference. You can see that some of the schools are within this area. You’ll use another for loop to select them.
- Type the following and press Enter-
for buff in buffList:
Now, let’s say you’re feeling a bit lazy, and you don’t feel like looking in the Help for the Select Layer by Location tool’s ArcPy function. Begin to type:
arcpy.sel
A screen tip displays a list of Arcpy functions, including the one you want, SelectLayerByLocation_management. Click on it.
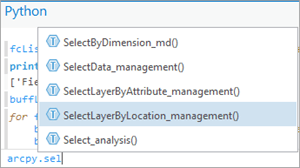
The Python window has other autocomplete options, too. Your cursor should now be within the parentheses, where you’re prompted to select an input feature class. A list of your current map layers has appeared.
- Select
Schools.
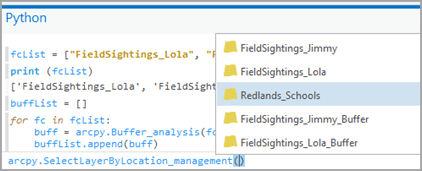
- Type a comma. This time, select
WITHINfrom the list that appears. - Fill in the rest of the parameters as follows-
arcpy.SelectLayerByLocation_management('Redlands_Schools', 'WITHIN',buff,0,'ADD_TO_SELECTION')

You chose the ADD_TO_SELECTION option because otherwise, the selection from the second feature class would overwrite that of the first. The 0 for the previous parameter is the search distance. That parameter doesn’t apply in this case, but the 0 acts as a placeholder.
- Press Enter twice. The six schools close to animal sightings are selected on the map.
- Save the project.
You’ve successfully identified schools at high risk from the runaway zoo animals. But your day is far from over, and you’ll likely need this code again later (the Python window transcript will clear when you close ArcGIS Pro). You’ll save it as a Python file, which you can load back into the Python window or refine further in another editing environment.
- Right-click the transcript and choose Save Transcript. Name the file ZooScript, and keep the default .py extension. Save the script to a location that you’ll remember.
In the next post, you’ll try running a standalone script in an external environment to continue providing support for the authorities as the zoo crisis continues.

Commenting is not enabled for this article.