ArcGIS Blog

Imagery & Remote Sensing

ArcGIS Excalibur

Use the Export Image tool for your presentations in ArcGIS Excalibur

By Megha Kakaraparti

ArcGIS Excalibur is a web-based, imagery application that enables users to search for, discover, and work with imagery. At the November 2021 release, ArcGIS Excalibur introduces a new tool called the Export Image tool to help export an image in a variety of ways for use in downstream analysis. The tool allows me to view a selected image as a snapshot, save the selected image, or even download the full resolution image.

In this blog, we will go through a workflow that shows you one of the many ways you can use the Export Image tool to support your image analysis.

Workflow

As an analyst, I need to help my manager find imagery for their daily briefings. Today, my job is to provide an image  that can help visualize the potential size  of  containers at a facility of interest.

After exploiting my image collection, I have identified an image that will work for my manager’s briefing. I can go to the Tools menu and open the Export Image tool. Before I export my image, I need to Draw my Area over my exploitation work to define my export extent. I have a few options to choose for export. I can view image snapshot, which opens the image up in a new browser tab as a JPEG, and Save image snapshot, which downloads the JPEG of my drawn area. Both options are good for presentations and briefings.
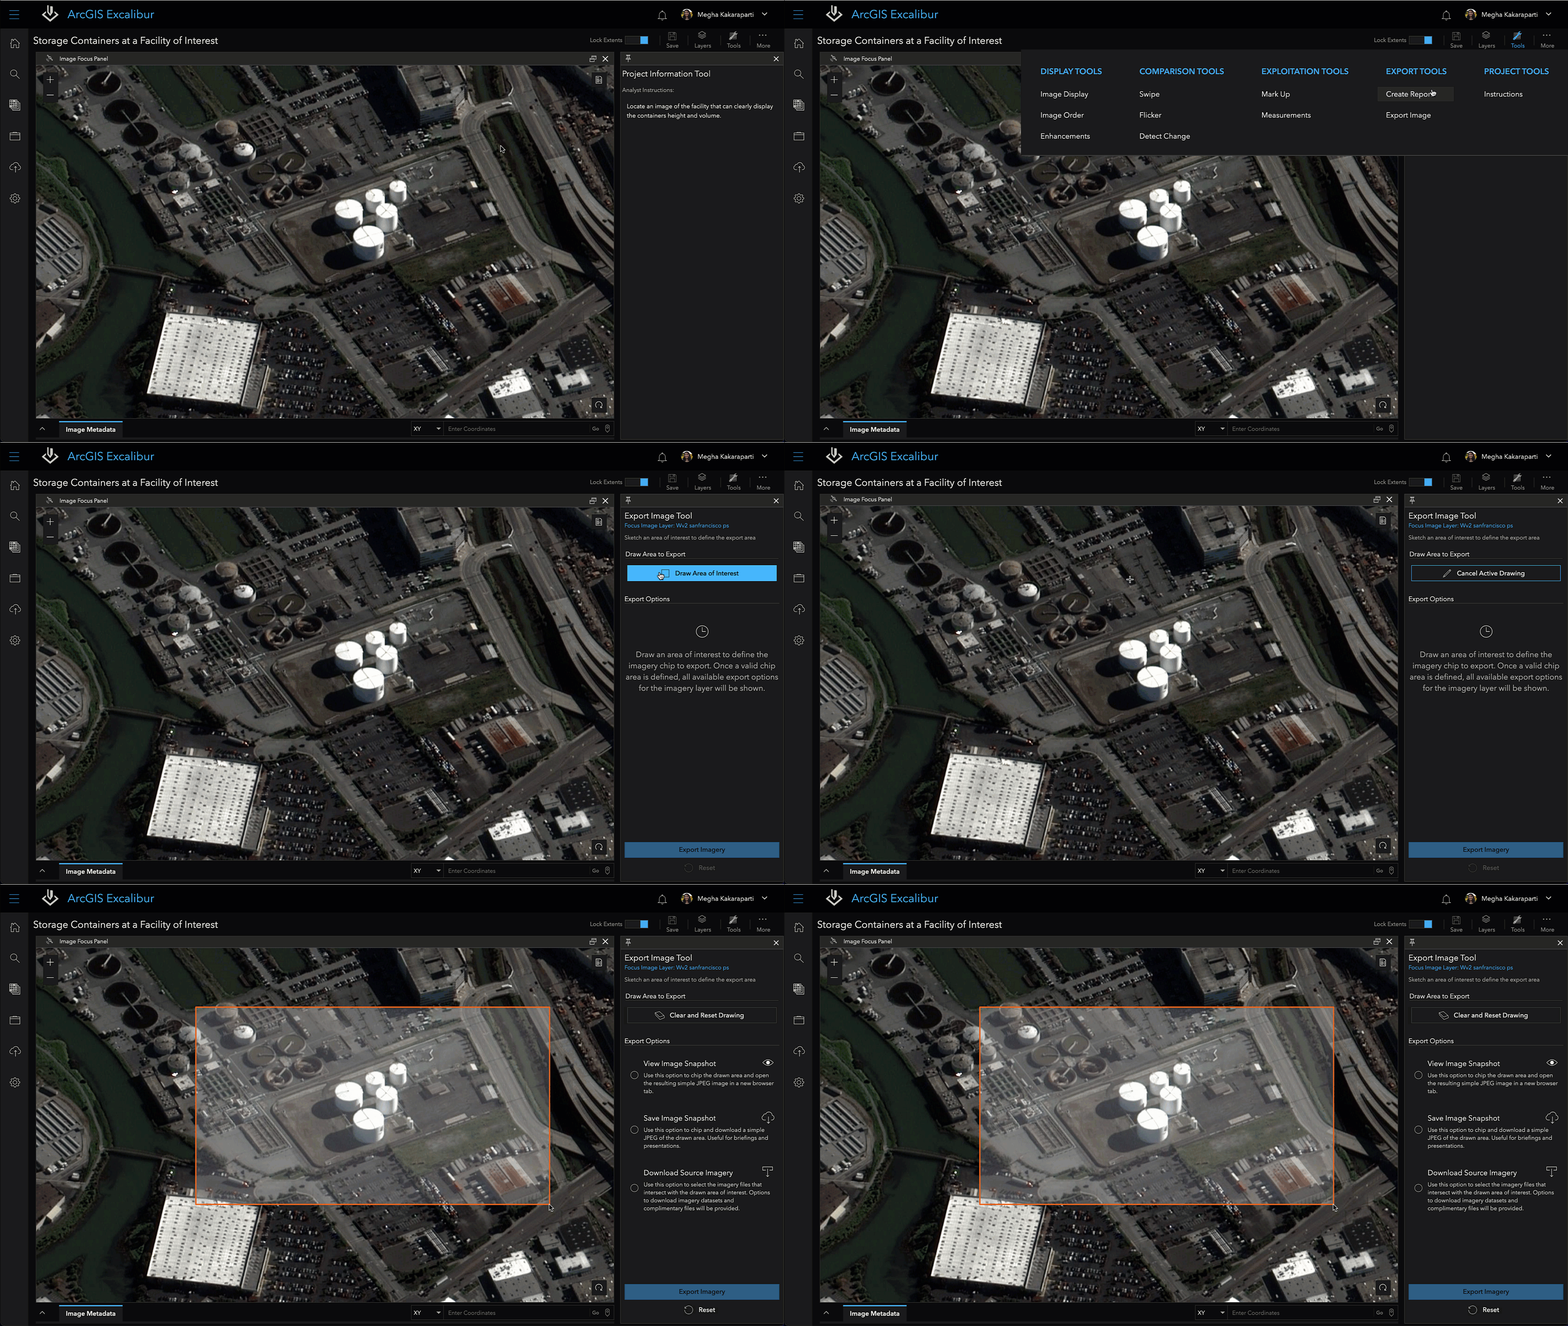
The Export Tool opens and once the user draws their AOI, a list of options appear

The Download source imagery option will select all imagery and their corresponding files in the drawn area of interest and make them available for download. This option is good if I want to work the imagery in additional mapping applications.

Since I must share my image with my manager, I want to save the image as a snapshot. I need to provide a name for my file such as Potential Container Size at Facility of Interest.  Now, I can export my imagery and it is available to use.
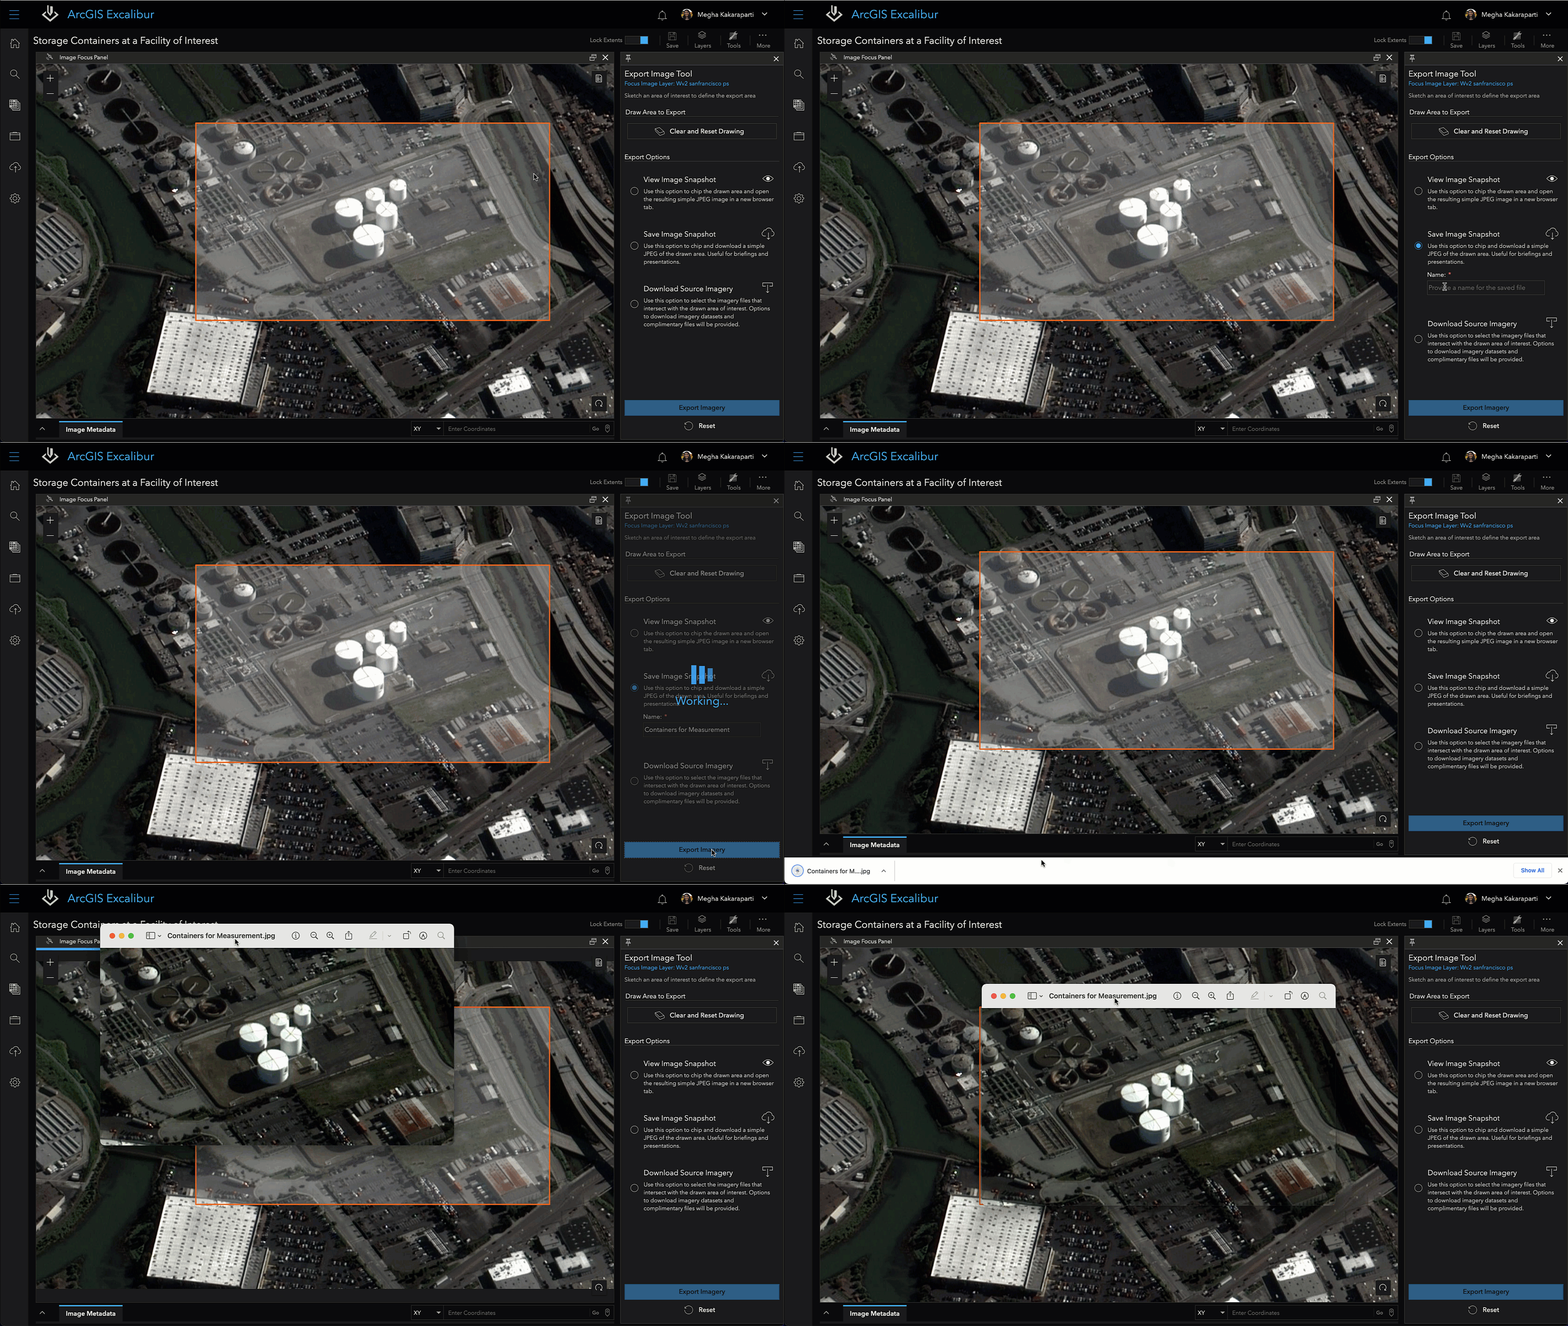
This is just one of the ways that the new Export Image tool in ArcGIS Excalibur helps you share your image-based work for downstream analysis. To learn more about ArcGIS Excalibur, visit our product page or read our documentation.

Share this article

Subscribe
Notify of
0 Comments
Oldest
Newest
Inline Feedbacks
View all comments
Anonymous
April 26, 2021 6:12 am

I am trying to implement this for my Org. I have followed along up until the configuration of the dashboard – step 5. How do I change the dashboard over to my own set of tables? Is it best to edit the json of the dashboard and replace the sample item id’s with my set? Also – to get the notebook to work – I had to comment out availble credits and assigned credits from the User Admin section of the notebook. Is this configured assuming we have turned on credit budgeting for the users – and if we haven’t… Read more »

Anonymous
April 23, 2021 8:32 am

Great stuff! We built a very similar dashboard and process for my company. We even made a StoryMap about it (Link below) . Dashboards are such a powerful tool that it can be used for non-spatial solutions as well.
Make an Item Report Dashboard (Public StoryMap): https://storymaps.arcgis.com/stories/136db4d3aaa84151be594b496f423a52

Colin Campbell(@colin-campbellrspb-org-uk_rspbeu)
January 16, 2023 5:48 am

This is really useful – thank you. Having set it up it up for our organisation’s account I’ve noticed a possible issue with the ‘FS Storage’ counter (and maybe some of the total credit measures used in other bits of the dashboard). The total number credits per month given in the FS Storage counter is much higher (almost 2x) than our total monthly credits usage as given by the ‘Overview’ tab in the ‘Organisation’ section of ArcGIS Online (which I’d consider to be the correct/definitive figure). Having had a bit of a search around, I’m wondering if it’s because the… Read more »

Bernie Connors(@geonb_bernie)
September 14, 2023 7:12 am

The notebook populates three tables:

  1. items
  2. users
  3. feature layers

But the instructions for updating the dashboard only requires changing the IDs for two of the tables. The user table does not appear to be used by the Dashboard. Is that correct?

Nour Salam(@nsalamjmt-com_jmt)
August 23, 2024 12:50 pm

Bonnie and Calvin: this is an excellent article! I am working on applying it for my organization. There is no longer an option to choose ArcGIS Notebook Python 3 Standard – 4.0. Instead, I can choose between 7.0 and 10.0. What would be causing that? @Calvin Kwon

Olivier Jobin(@oljo_rtc)
February 18, 2025 1:47 pm

I’m trying to implement this for my organisation and when running the notebook for the first (and subsequent) times, I get the following error :

dest_fl.delete_features(where="1=1")
Exception: 
This operation is not supported.
(Error Code: 400)

I run this on ArcGIS Notebook Python 3 Standard – 11.0.

Benjamin Hostetler(@hostebxmtf_wisdot)
March 27, 2025 1:25 pm
Reply to  Olivier Jobin

I have this same error. Any insight on resolving?

Paul Steeves(@paul-steevesottawa-ca)
February 25, 2025 12:21 pm

Excellent article! Exactly the item management solution we were looking for for our open data portal.