The Business Analyst widget in ArcGIS Experience Builder is now out of beta and has been redesigned to allow several customization options. For further information about the new enhancements, read The Business Analyst widget in Experience Builder is out of beta with great new features
This blog article will guide you through the process of creating a web application in ArcGIS Experience Builder using a web map that displays the spatial distribution of Black or African American and White residential segregation in the United States (To learn more about the web map, see Design a web map to analyze residential racial segregation in the U.S.). You will accomplish this task in five steps:
- Choose a template and configure it.
- Add data to the map.
- Pair the map with an infographic.
- Set an action trigger to display the infographic interactively.
- Configure an Alert widget to provide instructions about the application.
You can also view the final product: Black or African American and White Residential Segregation Web Application (arcgis.com). (To access this application, you must be signed in with an ArcGIS organization account to use the Business Analyst widget).
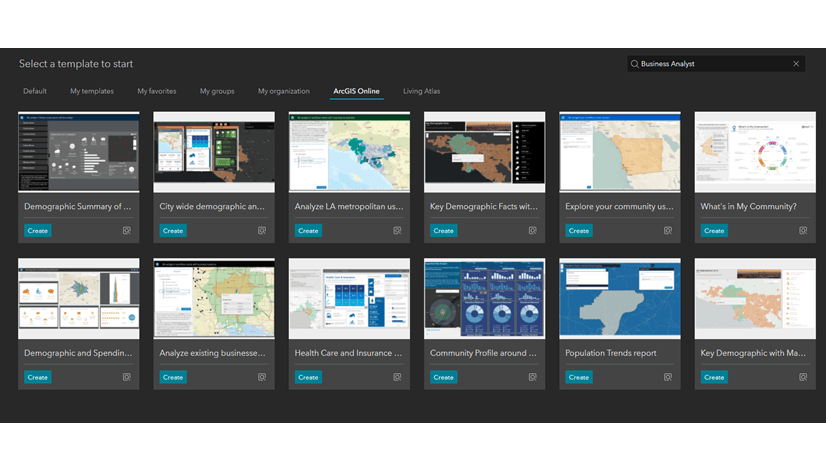
1. Choose a template and configure it.
- To get started, go to Experience Builder and click +Create new.
- Find the Foldable template and click Create.

- Turn off the Lock layout toggle button to start editing the template.

2. Add data to the map.
- Click Select map on the right-side panel and click Add new data.

- Click the ArcGIS Online tab and search the keyword “Justice40” and select Justice40_ICE Scores Map from the search results.
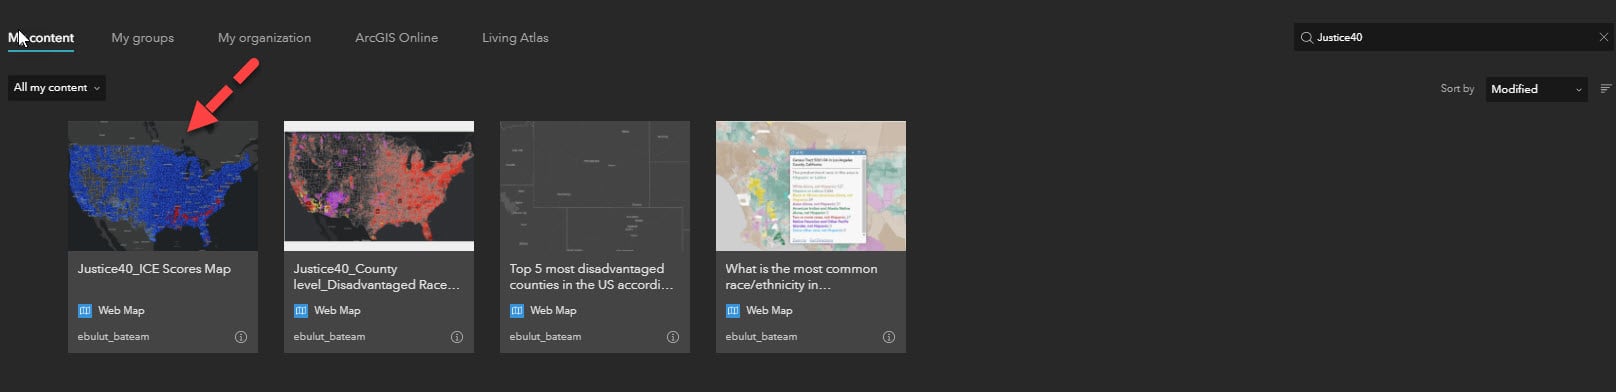
- Click the data and the Map widget will populate with selected data.
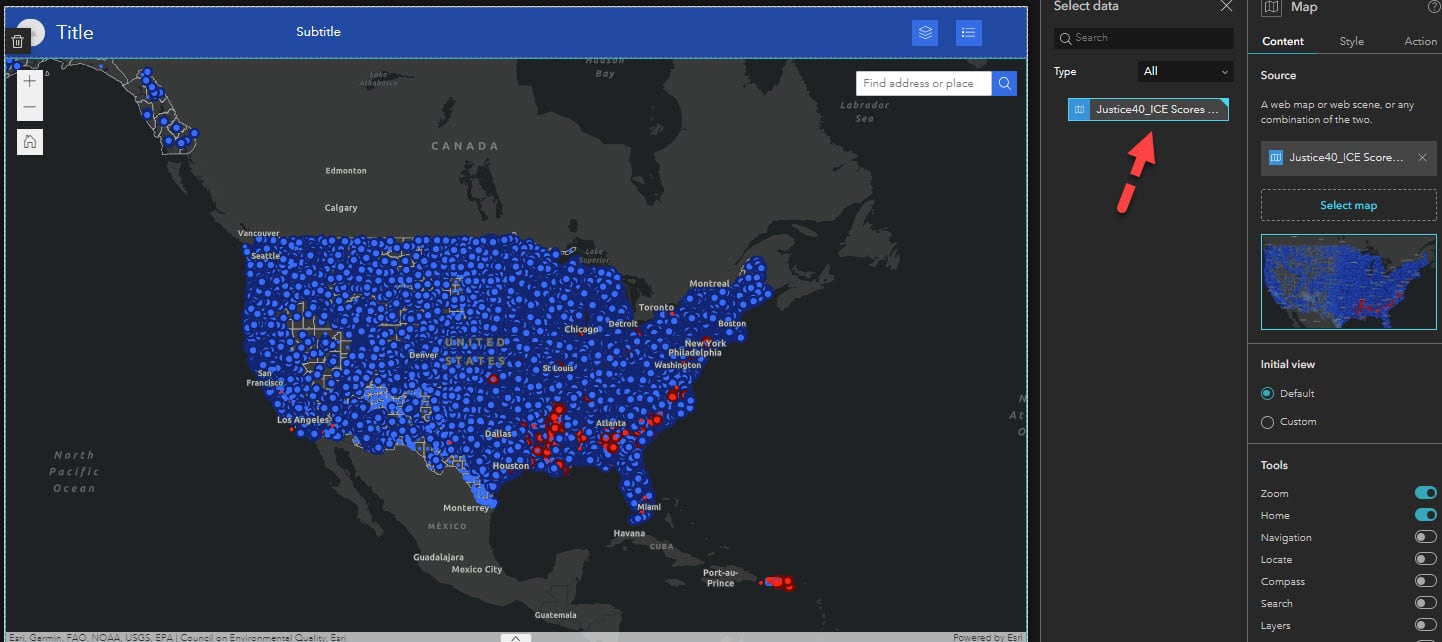
- You can keep the Default map extent or modify it by clicking Custom on the right panel.

- Click Modify and a new map window opens. Configure your map by zooming into the location you want and click OK.

Now it’s time to pair our map with an interactive infographic.
3. Pair the map with an infographic.
- Drag and drop Business Analyst widget from the Insert widget panel onto the app.
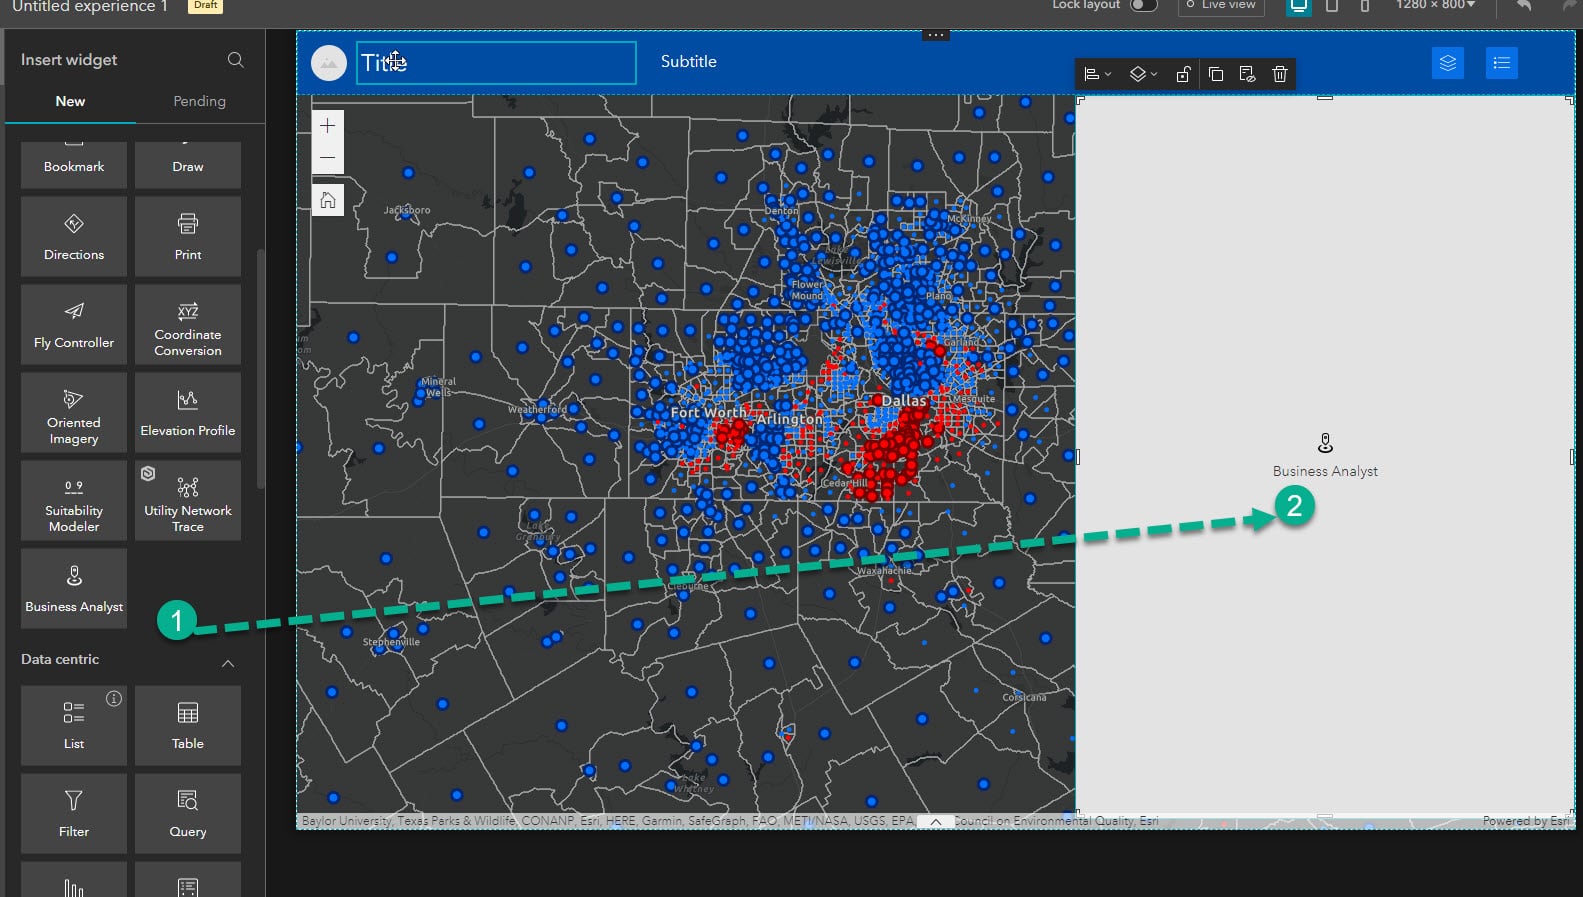
- Click Preset mode on the right panel. Rename and resize the Business Analyst widget as you wish.
- Under Select an infographic, choose the Justice40_ICE Profile as your infographic. (This is a custom infographic available in my organization. You can use any of the Esri Infographics to complete this task. The Esri infographics are curated by Business Analyst team and made available as ready-to-use templates accessible to anyone).
- Configure the infographic settings using the drop-down menus under Infographic settings. Select Full view mode, turn off both the Run-on Map click and Display Header toggle buttons.

4. Set action trigger to display infographic interactively.
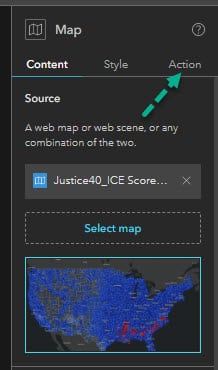
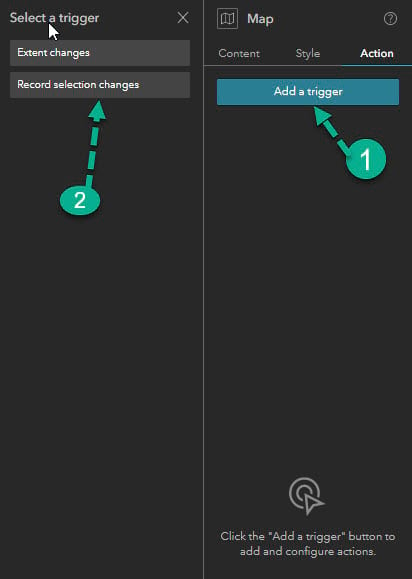
- Select the Map widget and click the Action tab on the right panel.
- Click Add a trigger and then click Record selection changes.
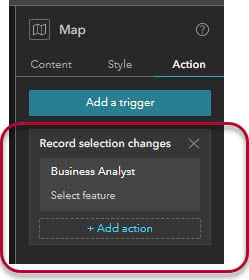
- Now click Business Analyst and then click Select feature. The widget is now paired with the Map widget and ready to interactively display the selection changes.
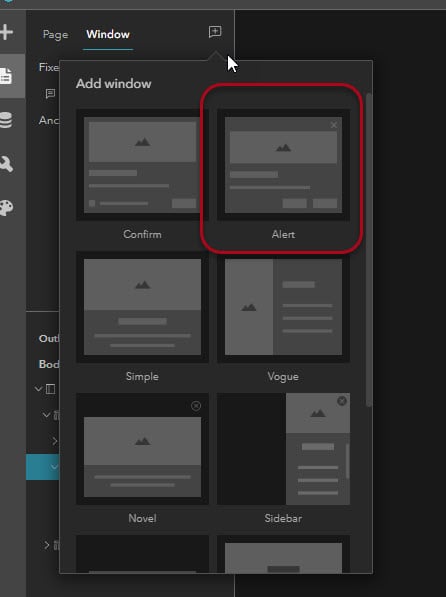
5. Configure an Alert widget to provide information and instructions about the application.
- Click Window on the left panel and add the Alert A window will pop up, alerting app viewers about the information you provide.
- Provide information and instructions about using the application.
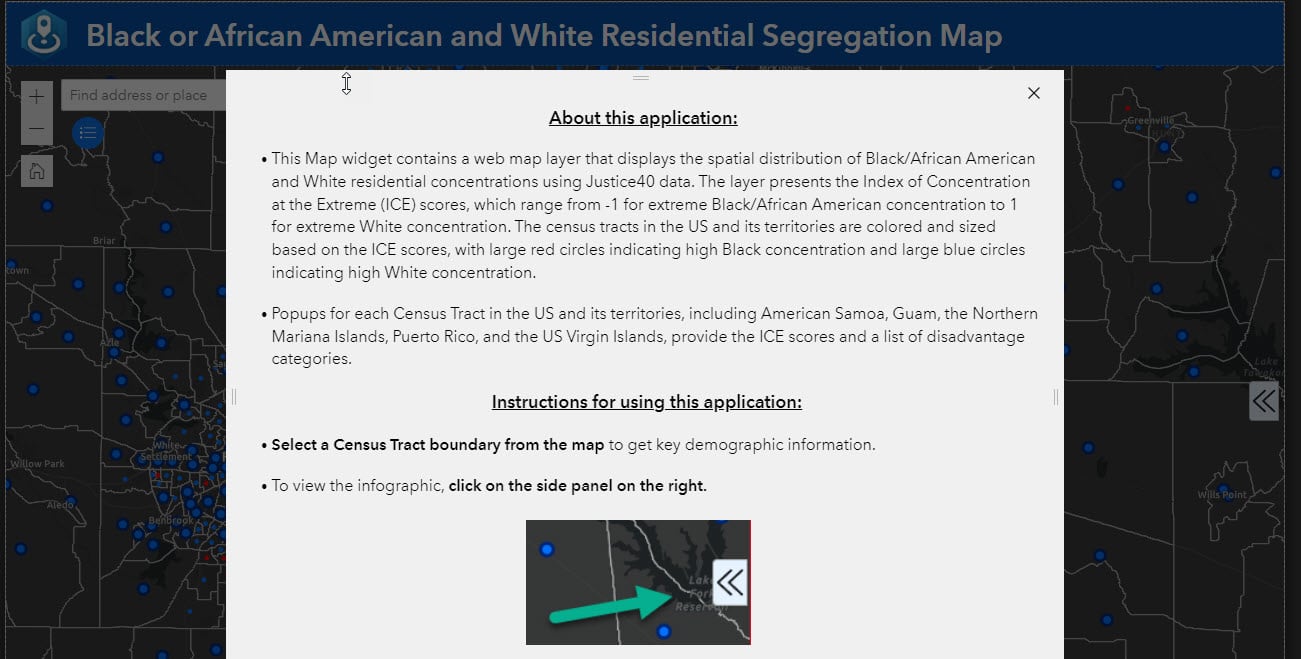
- Save the application and preview it before publishing.
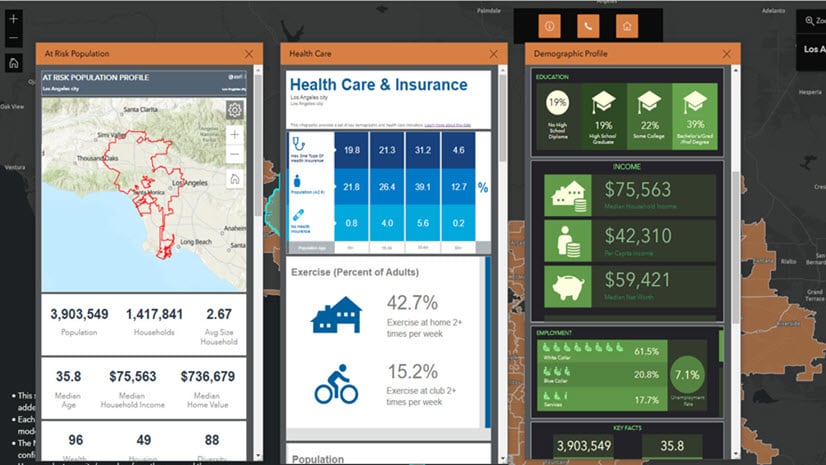
- Select a Census tract on the map to view key demographic information from the map layer you added.
- To view the Justice40_ICE Profile infographic, click on the side panel on the right.
Everything’s working as expected! Now you can publish the web application. Once you have published this web application, viewers of your app can click Census tracts on the map to learn about the degree to which Justice40 categories of disadvantage prevail—or not—in areas of extreme residential concentration as well as key demographic information. Local governments can use this web application to make plans to support equitable communities. Businesses can use the information from this web application to better understand the communities in which they operate and identify where and to whom they can contribute more equitable community outcomes.
Find and use Business Analyst web experience templates


Thank you! We looked for this last week and couldn’t find it (because the blog wasn’t available yet). We were going nuts. Templates are due tomorrow for multiple services and this saved us.
So happy it helped!
Thanks for the article! This approach doesn’t look to work with conditional expressions from what I can tell. Even just making a duplicate form with cond. expressions will break the form from what I can tell.
Hi Randall – thank you for the comment and apologies for the delay in response! I just tested this and was able to successfully copy over a form containing conditional visibility to another layer in a different map using AGO assistant. A few things could have happened that caused your form to break, most likely revolving around ensuring the entire object is copied over. Make sure that the entire formInfo object is copied over including the expressionInfos property. If you don’t include this property, the expressions will not carry over. If you’re replacing an existing formInfo object, be sure you… Read more »
I need to create and manage Field Maps for many projects in dozens of parks. We’re likely to reach the limit of 16 offline areas per map fairly quickly, so duplicating maps should be a big help. This article mentions making “slight adjustments” to the copy of the map. Do you mean to imply that some types of changes would cause problems with the original map or forms? Is it okay to add or remove layers, and if so, does this apply to both operational and reference layers? Change a form or create a form for an additional layer? Filters?… Read more »
Hi Jill – thank you for your comment. I’m glad to hear this is helpful for your park workflow! I used the phrase “slight adjustments” for the context of the scenario in this blog post – it was not meant to imply that changes made to the map copy will cause problems to the original map. You can add and remove operational and reference layers, edit the form for additional and existing layers, and edit other properties of the map copy without changing the original map. If you make changes at the layer level, such as enabling sync, allowing editing,… Read more »
Is the technique of copying forms available in the Map Viewer as well as Field Maps? I’ve attempted copying the forminfo in the AGO Assistant without luck and I’m wondering if it’s just not an option for my application (or if I need to do more troubleshooting).
I was able to use the AGO Assistant approach, great instructions. For the python instructions, it would be helpful to include directions for folks that use SAML authentication.
When I look in AGO Assistant there is not a formInfo JSON object in my layer. Is it because I saved my form to the layer and not to the map? If so is there another way for me to create the formInfo JSON object?
I’m in the same boat as Jim as we will need to make several maps for several project and I would like to reuse the form on a new layer without having to re-create it every time.
I used AGO Assistant and copied everything over. I’m looking at the syntax and everything seems to be there but it’s not working. I even copied the entire JSON and it did not work either. Thankfully, I kept all of my forms open in a separate browser. So that I can painstakingly copy everything over one by one. There must be a better way. ugh