Recently, we had the opportunity to talk with Alejandro Vidal, co-founder and CEO of GIS Routes, about the work they’ve been doing during the private preview of ArcGIS GeoAnalytics for Microsoft Fabric. Vidal and Msc. Héctor Galeros, head of the GIS Routes AI and Analytics team, explored ways to integrate advanced geospatial capabilities into client solutions, setting new standards in data-driven logistics. It was a truly enlightening experience to hear about their analytic approaches and the impact they are making in the field.
Originally launched through the Esri Startup Program and now an Esri Silver Partner, GIS Routes is a SaaS platform that optimizes last-mile logistics, providing real-time insights and advanced analytics to enhance operational efficiency, reduce costs, and improve service levels.
ArcGIS GeoAnalytics for Microsoft Fabric is a Spark library that offers geospatial analytics functions, enabling high-speed integration, transformation, enrichment, and analysis of geospatial data at any scale within the Microsoft Fabric environment.
GIS Routes’ participation in the private preview provided them with a unique opportunity to test ArcGIS GeoAnalytics for Microsoft Fabric capabilities across various aspects of their operations. In the following sections, we will explore the key analytics challenges that GIS Routes faced and how ArcGIS GeoAnalytics for Microsoft Fabric has transformed their data processing and analysis workflows.
Reducing data processing time from 18 hours to 20 minutes
The GIS Routes team relies on datasets of more than 100 million GPS data points with numerous attributes including location, speed, battery life, and signal quality from vehicles to optimize vehicle routes and projections of delivery time.
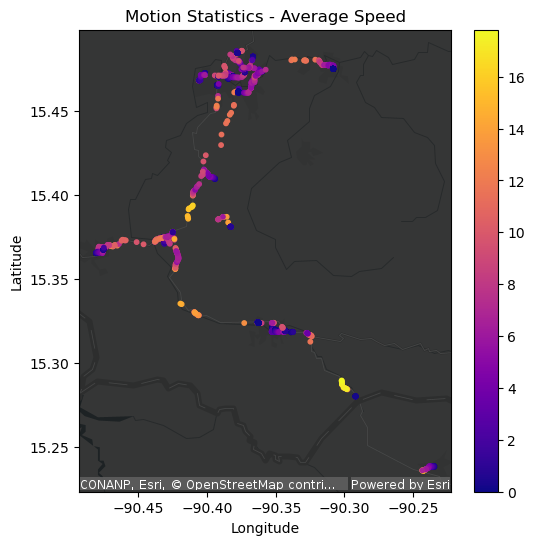
Prior to their work with GeoAnalytics for Fabric, they were unable to process the dataset as a whole. To manage this large dataset, they needed to break it into smaller batches of no more than 10 million data points each due to processing limitations. They processed each batch using Python and SQL Server, which required more than 18 hours to process all the batches. Because of the lengthy processing time, updates using this data were only done every three months, which meant the data was often outdated and did not reflect current conditions. Additionally, the need to batch the data instead of processing it limited the workflow’s efficiency and hindered larger-scale modeling efforts that would benefit from using the larger dataset.
ArcGIS GeoAnalytics for Fabric could handle the entire dataset of over 100 million data points without the need to break it into batches, and it reduced the processing time from 18 hours to just 20 minutes.
The advanced algorithms and optimized processing capabilities of ArcGIS GeoAnalytics for Microsoft Fabric, combined with the distributed processing in Fabric’s Spark environment, made it possible for GIS Routes to analyze vast amounts of data quickly and accurately.
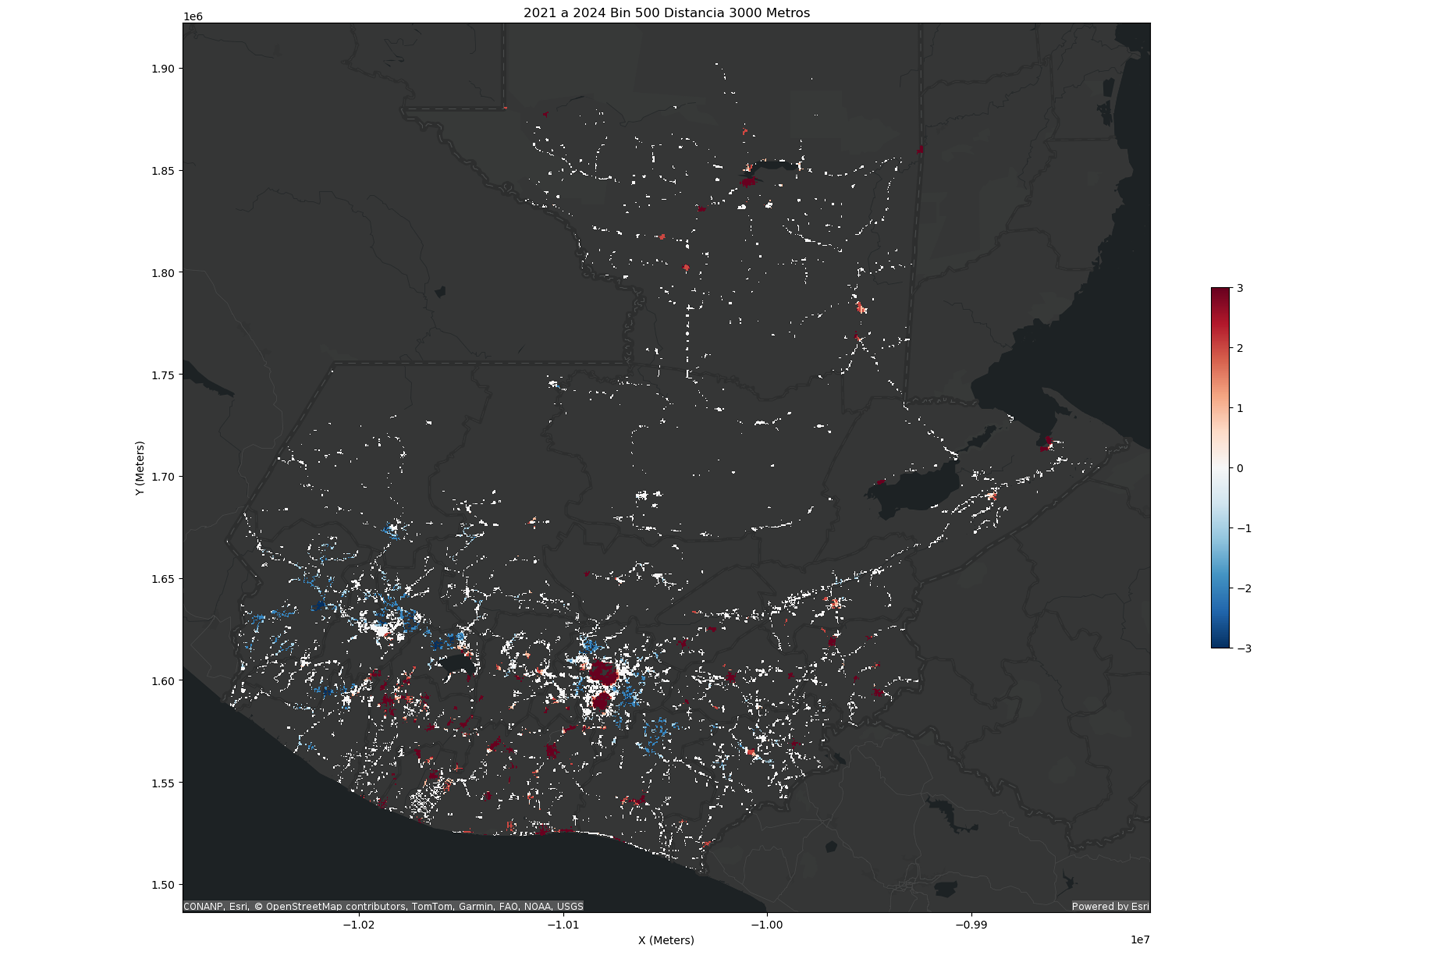
The GIS Routes team can now update their data more frequently, potentially shifting from quarterly updates to daily updates. This increases the relevance and accuracy of the data, enabling daily insights and faster responses to evolving market dynamics. The streamlined updates also facilitate better integration with machine learning and AI models, leading to more effective and timely analysis of stop times, route efficiency, and other key metrics. This, in turn, enhances GIS Routes’ ability to help their clients plan and optimize their service routes. Additionally, the streamlined workflow reduces the need for multiple team members to handle different parts of the data processing, resulting in a more cohesive, efficient, and reproducible workflow.
Improving the accuracy of estimated arrival and departure delivery times
Another challenge GIS Routes is facing is the collection of accurate arrival and departure time data from delivery sites. This data helps estimate how much time drivers spend at each delivery site and how many stops, and in what locations, a driver can realistically make in a daily route.
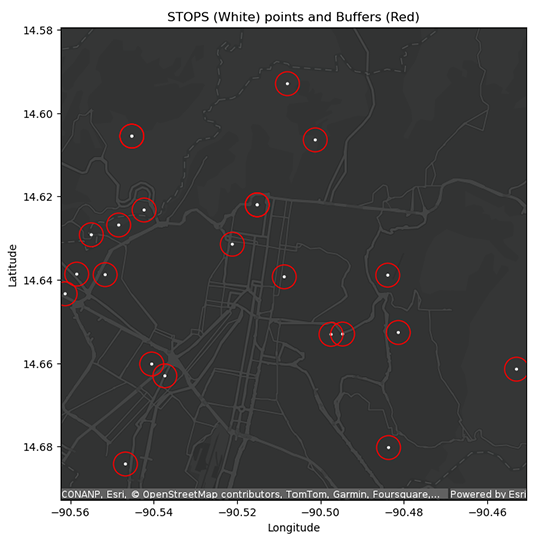
Accurate prediction of arrival and departure data enhances route planning for each vehicle, maximizing the number of deliveries each vehicle can handle in a day. One of the critical issues in modeling these processes is the inconsistency in the timing data provided by drivers. Drivers press a button once a delivery is made to mark the delivery, but the actual times of arrival and departure at delivery locations may be inaccurate. This inaccuracy begins with the first delivery delay and builds up with each subsequent stop, causing progressively larger delays throughout the day. By the end of the day, the predicted delivery times can be off by more than an hour. This leads to errors in the data used in the planning models, which affect the reliability of service times and other operational measures.
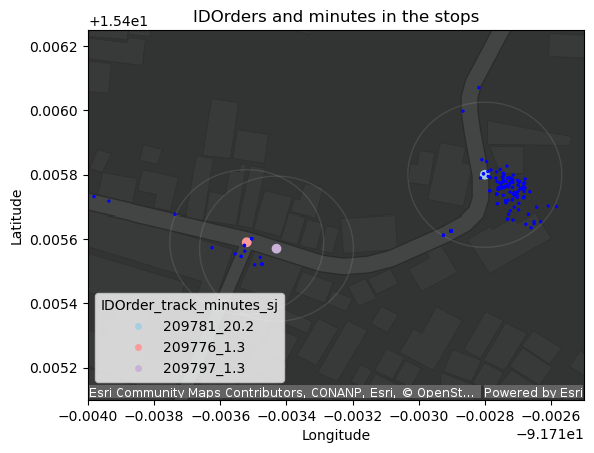
With ArcGIS GeoAnalytics for Microsoft Fabric, we addressed this issue by using GPS breadcrumbs to estimate actual arrival and departure times, creating a more accurate picture of the driver's movements and updating data in less than a minute frequency on the client-facing website.
By automating their analysis of the GPS data and comparing it to the driver-reported times, the team can identify the precise moments when the driver arrives at and leaves the delivery location. This method of data cleaning and enhancement provides a more reliable dataset for analysis and predictive modeling.
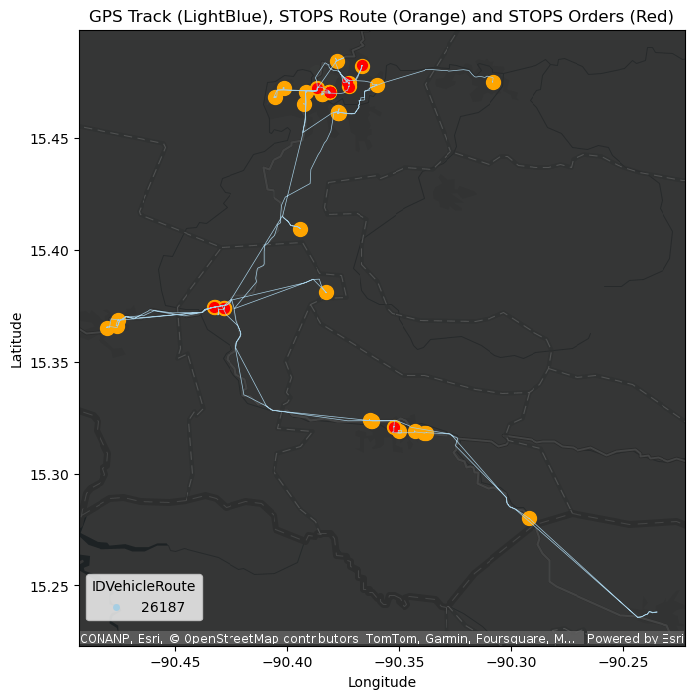
The improved data quality and accuracy will have a significant impact on their clients’ operations. Better planning and optimization of routes are possible, as the data from automated analysis reflects the true service times. This will lead to more efficient delivery schedules and reduced operational costs. Moreover, the enhanced data quality can improve the performance of statistical and machine learning models. With ArcGIS GeoAnalytics for Microsoft Fabric, statistical and machine learning models can be automated to continuously run using the most recent data, providing more accurate and actionable insights for operational recommendations and predictive analysis.
Driving innovation with spatial analytics in Microsoft Fabric
The GIS Routes team is excited about the results achieved from the private preview testing of ArcGIS GeoAnalytics for Microsoft Fabric. The ability to handle larger volumes of data and perform more extensive analysis has already shown significant benefits. Looking ahead, they see numerous possibilities for improving GIS Routes operations and service.
ArcGIS GeoAnalytics for Microsoft Fabric will improve our operations by giving us better control over data, operations, and the security of our clients' data, and by making our operations faster. The future looks promising, and we are eager to leverage these capabilities to drive further growth and innovation.
The platform’s scalability will allow them to process even more geospatial data, enabling them to perform detailed temporal analysis, such as comparing patterns on different days or over multiple years. This will provide deeper insights and better operational planning.


Alejandro Vidal is a highly accomplished computer science and systems engineer, as well as an entrepreneur, with over 20 years of experience in software architecture and the geospatial sector. Alejandro focuses on leveraging GIS to solve real-world challenges, connecting user needs with cutting-edge technology. Since 2003, he has been actively involved in last-mile logistics projects, working with Esri technology, real-time native apps, and advanced analytics. In 2016, he co-founded GIS Routes to revolutionize last-mile logistics.


Article Discussion: