MapImageLayer is a big deal. So big that it can be displayed in MapViews or SceneViews, with labels, with popups, with registered workspaces, and it can be dynamically rendered on the fly when dynamic layers are enabled on the Map Service. For more background information, you can check out the previous blog: What’s the Deal with MapImageLayer?
At the April release of the ArcGIS API for JavaScript, you can create a FeatureLayer equivalent of a MapImageLayer sublayer by using the createFeatureLayer() method on the Sublayer class. This means that you can now do things like unlock the power of 3D web mapping using a 2D MapImageLayer by making use of the 3D capabilities of the FeatureLayer.
Kristian Ekenes recently published a blog about building 3D web apps with 2D data, which inspired me to think more about 3D web applications. Using the new createFeatureLayer() method on the Sublayer class you can now make use of visualization tools like Smart Mapping and visual variables. You can also use 3D symbologies like PointSymbol3D and WebStyleSymbol. Now let’s take a look at a 3D web application using this new createFeatureLayer() method with MapImageLayer.
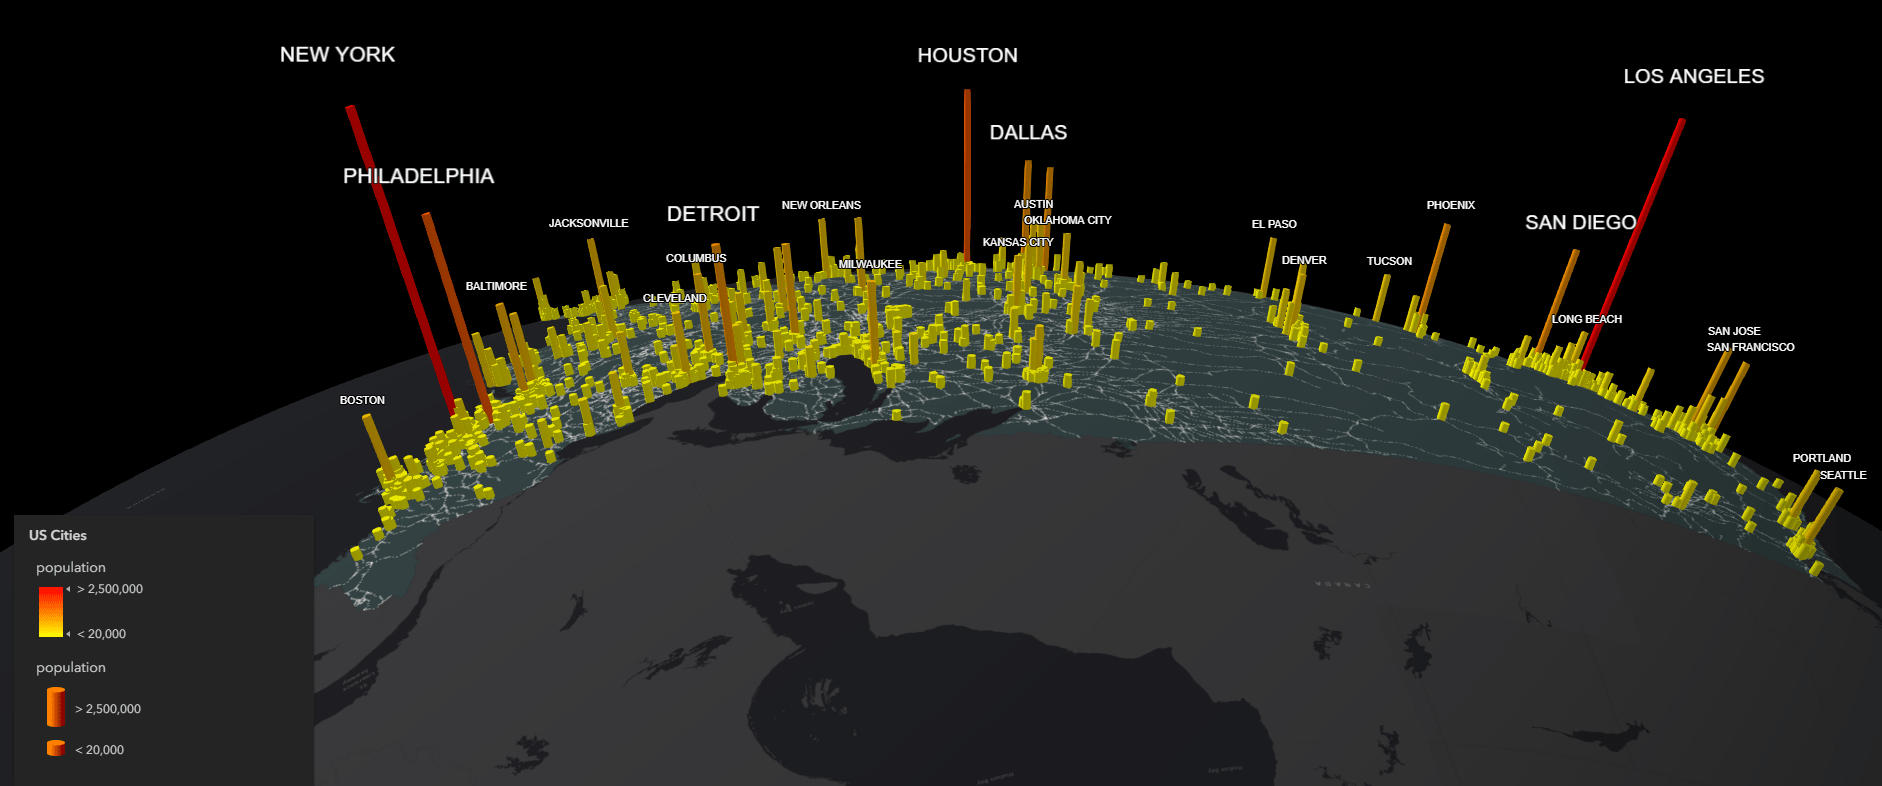
This sample app shows population in US cities in a SceneView, using a map service as the data source.
First, we initialize the MapImageLayer, and define the sublayers. Here we make extensive use of dynamic layers for their ability to render and create layers on the fly. Four of the sublayers are accessbile directly from the REST endpoint, and two are DynamicDataLayers. These DynamicDataLayers reside in registered workspaces, and are created using a TableDataSource and a QueryTableDataSource. Note that the Places sublayer will be used later to create a FeatureLayer, so it’s visibility is initially set to false.
const mlayer = new MapImageLayer({
  url: "https://sampleserver6.arcgisonline.com/arcgis/rest/services/USA/MapServer",
  sublayers: [
  {
    id: 0,
    title: "Cities",
    visible: false
  }, {
    id: 1,
    title: "Highways",
    visible: false
  }, {
    id: 2,
    title: "States",
    visible: true,
    renderer: stateRenderer
  }, {
    id: 3,
    title: "Counties",
    visible: false
  }, {
    id: 4,
    title: "Places",
    visible: false,
    source: {
      type: "data-layer",
      dataSource: {
        type: "query-table",
        workspaceId: "MyDatabaseWorkspaceIDSSR2",
        query: "SELECT * FROM ss6.gdb.Places WHERE population > 20000",
        oidFields: "objectid"
      }
    }
  }, {
    id: 5,
    title: "Railroads",
    visible: true,
    renderer: railRenderer,
    source: {
      type: "data-layer",
      dataSource: {
        type: "table",
        workspaceId: "MyDatabaseWorkspaceIDSSR2",
        dataSourceName: "ss6.gdb.Railroads"
      }
    }
  }]
});
After the MapImageLayer is ready, we use the findSublayerById() method on the MapImageLayer to return the Places sublayer. Then we call the createFeatureLayer() method on that same sublayer to create a new FeatureLayer, set its visibility to true, and add it to the map.
mlayer.when(function() {
  const mSublayer = mlayer.findSublayerById(4);
  const mSublayerFeatureLayer = mSublayer.createFeatureLayer();
  mSublayerFeatureLayer.visible = true;

  map.add(mSublayerFeatureLayer);
};
Next, we can treat the newly created FeatureLayer much the same way we treat any FeatureLayer. We apply a SimpleRenderer using PointSymbol3D, and enhance the display with two visual variables: size and color. Now we have our features rendered with continuous size and color ramps, defined by stops we configured in the code.
mSublayerFeatureLayer.renderer = {
  type: "simple",  // autocasts as new SimpleRenderer()
  symbol: {
    type: "point-3d",  // autocasts as new PointSymbol3D()
    symbolLayers: [
      {
        type: "object",  // autocasts as new ObjectSymbol3DLayer()
        resource: {
          primitive: "cylinder"
        },
        width: 25000  // width of the symbol in meters
      }
    ]
  },
  label: "Population",
  visualVariables: [
    {
      type: "size",  // SizeVisualVariable
      field: "population",
      stops: [
        {
          value: 20000,
          size: 25000
        },
        {
          value: 2500000,
          size: 1000000
        }
      ],
      axis: "height"
    }, {
      type: "color",  // ColorVisualVariable
      field: "population",
      stops: [
        {
          value: 20000,
          color: "yellow"
        },
        {
          value: 2500000,
          color: "red"
        }
      ]
    }, {
      type: "size",
      axis: "width-and-depth",
      useSymbolValue: true  // uses the width value defined in the symbol layer
    }
  ]
};
We also add two LabelClasses to display labels for cities of certain population sizes. Cities with populations over 1,000,000 people have large labels, and cities with populations between 400,000 and 1,000,000 have small labels. Cities with fewer than 400,000 people are not labeled to avoid overcrowding the map. For more information about labeling, refer to our Labeling Guide page.
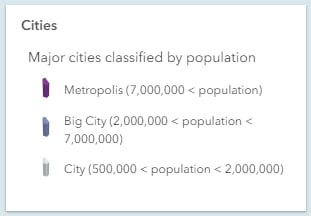
Raluca Nicola created another app, showing population in world cities in a local WebScene, to demonstrate just how beautiful and powerful this functionality can be.
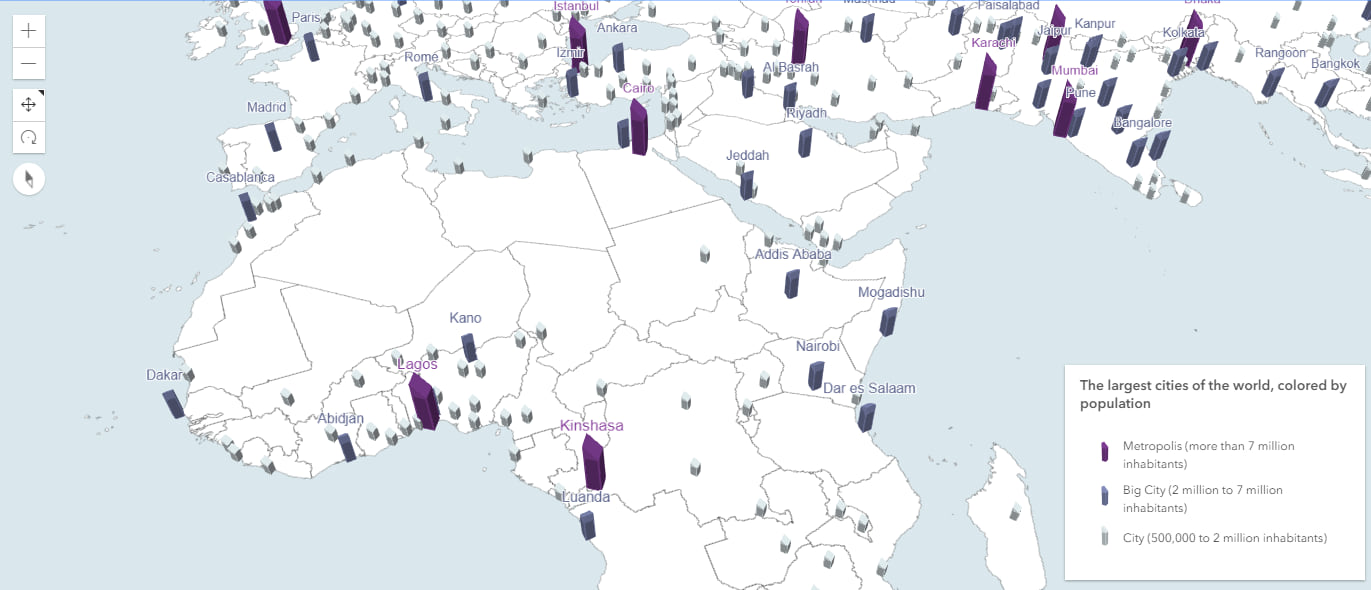
This is a great example of using custom WebStyleSymbols to symbolize a MapImageLayer containing 2D data. A web style can be referenced with a URL or a registered style’s unique name (you can learn how to publish your own custom WebStyleSymbol in this blog). Instead of dots and cylinders, we now have custom 3D building symbols rendered with a ClassBreaksRenderer, which are also added to the legend. Then, two LabelClasses are added to display labels for cities of certain population sizes (> 2,000,000), and popups are added using the PopupTemplate.
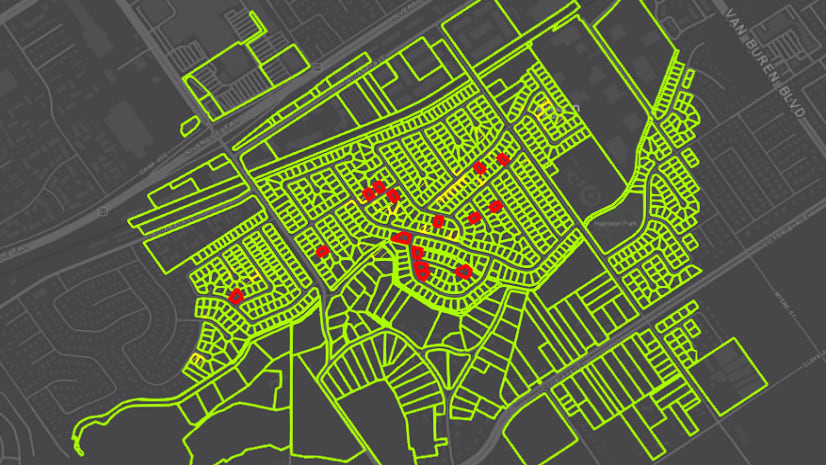
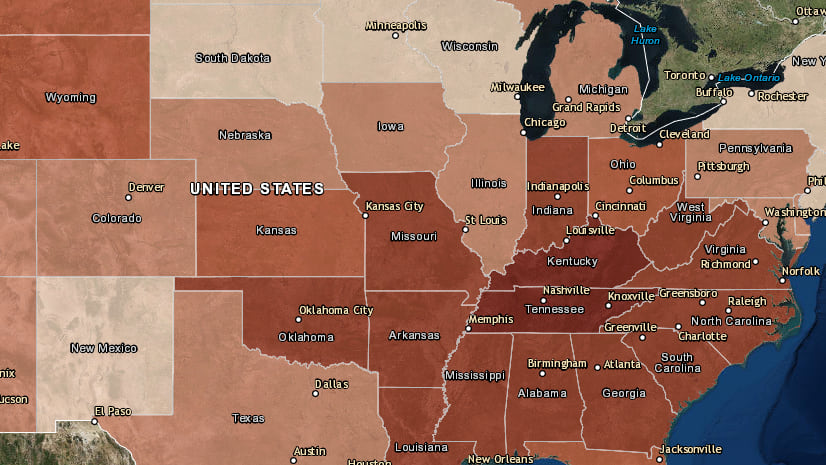
For comparison, here is what the Map Service looked like when it was initially published.
This blog explored using 3D symbology and visual variables with the MapImageLayer. Combining the createFeatureLayer() method with the dynamic abilities of MapImageLayer greatly enhances the visualization options that are available. Other opportunities, such as using smart mapping with the MapImageLayer, can also be found in our samples. One last thing worth noting is that while we can now create a FeatureLayer instance based on a Sublayer’s configuration, FeatureLayers can also be constructed with dynamic data sources by passing the appropriate data source to the dynamicDataSource property of the FeatureLayer. Stay tuned for more exciting developments with the ArcGIS API for JavaScript.

Commenting is not enabled for this article.