Virtualized environments provide certain advantages for organizations such as allowing multiple users to simultaneously share hardware resources through virtual machines (VMs). These systems can scale from a few workers to hundreds sharing resources from one or several host servers. There are various considerations for using the ArcGIS Maps SDK for JavaScript (JavaScript Maps SDK) in these environments including tuning your Virtual Desktop Infrastructure (VDI) and designing your visualizations for best performance. This blog introduces basic tuning concepts since designing visualizations has been covered in detail through other blog posts and articles referenced below.
Tuning VMs for Web Mapping Applications
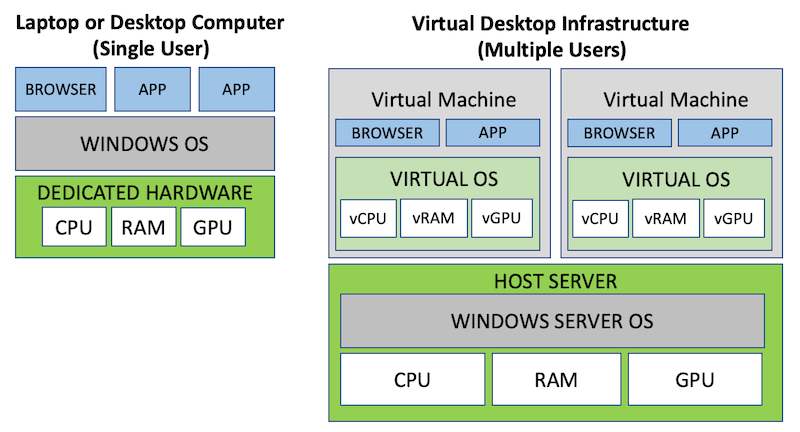
Tuning, or sizing, your VDI involves allocating resources to individual VMs. It has options and considerations that are very similar to purchasing dedicated physical hardware, such as a laptop or desktop. However, VM architecture is significantly different and its performance characteristics can vary widely. Here is a conceptual overview comparing a laptop or desktop computer to a VDI.

For VMs running applications built with the JavaScript Maps SDK, attention needs to be focused on allocating virtual memory (vRAM), virtual CPU (vCPU) and virtual graphics processing (vGPU) that meets or exceeds the JavaScript Maps SDKs System Requirements. We also recommend consulting with your VDI manufacturer for the latest best practices for tuning your environment.
No one-size-fits-all approach. Sizing virtual machines for your web mapping users is based on the system load created by the applications they use for daily tasks, and having adequate vCPU, vRAM and vGPU available for each user. For example, users focused primarily on data entry place a significantly lower workload on the host server compared to users working with web mapping visualizations. In this oversimplified scenario, data entry worker VMs could be allocated fewer hardware resources than VMs for users doing graphic intensive work.
When VMs are not sized correctly for JavaScript Maps SDK applications, end users notice poor performance such as high latency, stuttering or even reduced rendering quality. This is typically the result of the browser only being able to deliver low frame rates, also referred to as frames per second (FPS). There are a variety of reasons for this including high vCPU usage, no vGPU, older and slower hardware in the host server, slow network, improperly configured VMs, and even older browser versions that may have WebGL performance bugs.
Graphics acceleration. Applications built with the JavaScript Maps SDK use WebGL for graphics acceleration to provide rich and immersive visualization capabilities in the browser. Many common business applications also take advantage of graphics acceleration, including Chrome, Edge, Outlook, and PowerPoint. These types of applications often provide the best user experience when run on machines that have a physical GPU or vGPU. This is because GPUs are specifically designed to offload graphics processing from the CPU, leaving the CPU to focus on non-graphics related tasks. In fact, most modern computers come with a GPU.
However, these applications also work on VMs that do not have a vGPU, but this requires additional vCPU and vRAM per user to make up the difference in processing power and to avoid performance slowdowns. CPUs are less efficient than a GPU when handling graphics processing, and they are also simultaneously handling all the other tasks assigned by the operating system.
Minimum requirements
Inadequate virtual processing resources can occur within an individual VM or on the host server when there are too many users accessing finite resources. It takes time to research these issues to identify performance bottlenecks and then resolve them. As mentioned above, the JavaScript Maps SDK System Requirements also apply to virtual machines. In particular, it is recommended that VDI implementations have a physical GPU in the host server and allocate vGPU resources and a minimum of two vCPUs for each VM. The vCPU allocation also ensures the configuration aligns with the minimum requirements for using Chrome and Edge in virtual environments. If virtual resources are allocated below the minimum hardware requirements, users should expect performance degradation.
Performance analysis tools
There are a number of tools and best practices that help with tuning a VM for best performance when using JavaScript Maps SDK applications. And, it’s important to use a variety of tools to get a complete picture of how fast or slow the VM is performing compared to physical laptops and desktop computers.
Many organizations deploy tools for performance monitoring for the entire VDI, however that may not always give enough information to quantify the end user’s experience in an individual VM, while running a specific web application. It depends on how the VDI is configured.
VMs typically do not work like a stand alone computer with a single user, and this is because the host server’s hardware resources are being shared with other users. For example, if the host server is overprovisioned, then individual VM performance may fluctuate depending on resources available on the host server, at a specific time. Overprovisioning is a scenario where the VDI is configured to promise fixed server hardware resources to too many users resulting in performance slowdowns for everyone. And, since VM usage is variable throughout the day, it can be challenging for IT staff to implement a perfect solution.
This section provides a sampling of common end-user tools to help give you insight into how individual VMs are performing. These tools include Windows Task Manager, CPU benchmarks, Chrome DevTools, and also browser benchmarks.
Windows Task Manager. This handy tool has a Performance tab that lets you determine CPU type, the number of vCPU cores and vRAM allocated to a VM. You can also measure CPU and memory utilization over time. A VMs vCPU and vRAM allocation is dependent on how its configured in the VDI. However, as mentioned above, this configuration is not a guarantee of physical resource availability on the host server. You can use this tool to take measurements while going through common workflows with your web mapping application. Then you can compare measurements taken at various times during the day, or even compare them to other VMs that are similarly configured.
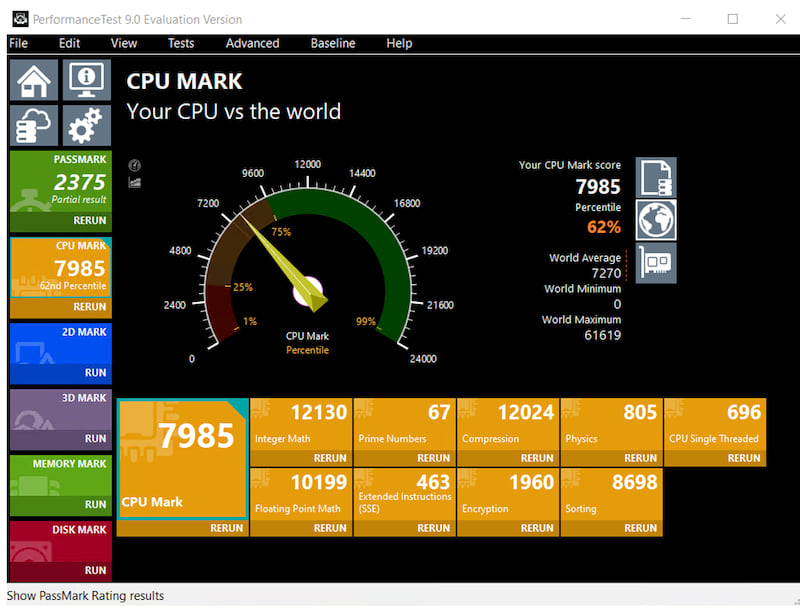
CPU benchmarks. There are industry standard CPU benchmarks tools, such as PassMark, that can give an approximation of how well a vCPU configuration compares to the relative speed of hundreds of other dedicated, physical processors that have run thousands of benchmarks. In general, better results indicate faster performance. Keep in mind, there isn’t an exact translation between virtual and physical hardware, and the benchmarking results from a VM are only an approximation of their physical world equivalent.
Always research the benchmark manufacturer’s documentation to understand how to interpret results. For example, if the test results indicate the vCPU is on the low end of the spectrum, such as the equivalent of a 2009, 2-core CPU, you can expect that VM most likely won’t perform as well with visually intensive tasks as it would with static web pages that don’t involve web maps.
Here is a screenshot of a VM that tested slightly above the average world benchmark for performance:

Chrome DevTools. These tools are well documented, and can provide detailed insight into how JavaScript applications perform including finding coding errors, measuring request/response times and doing detailed memory snapshots. These tools are crucial for tuning web mapping applications, and this is discussed in the next section.
Browser Benchmarks. There are also browser benchmark tools, such as Basemark Web 3.0, that can be used to provide insight into how the browser, itself, is performing within the VM. This type of tool can help uncover various types of browser bottlenecks, and it removes the web mapping application from the equation so that you can focus on pure system performance.
Web mapping application tuning
In addition to tuning VMs, your geospatial data and JavaScript Maps SDK applications should also be designed with performance in mind. Just like it is possible to have too few VM resources, due to basic physics it is also possible to create a mapping application that will perform poorly on the most powerful physical machine in your organization. For this reason, we have blogged extensively about improving your data as well as designing your application for the best visualization performance, here are several key articles:
- Mapping Large Datasets on the Web
- Enhancements for Mapping More Data, More Efficiently in the Browser
- Techniques for Visuaizing High Density Data on the Web
- Styles and Data Visualization – JavaScript Maps SDK Guide Topic
Conclusion
VMs often perform differently than dedicated, physical computers, and virtualization introduces additional considerations for tuning both the VM and your web mapping applications. VMs should be configured to the same system requirements as a physical computer including having access to a GPU for best visualization performance. Last, in addition to designing your web mapping applications for best performance, it is recommended to use a variety of commonly available tools to analyze and benchmark VMs to uncover potential configuration bottlenecks.


Article Discussion: