ArcGIS Monitor collects metrics focused on both ArcGIS Enterprise components and the underlying infrastructure. It provides a comprehensive overview of system health, performance, and helps administrators get the most from their GIS and IT investment.
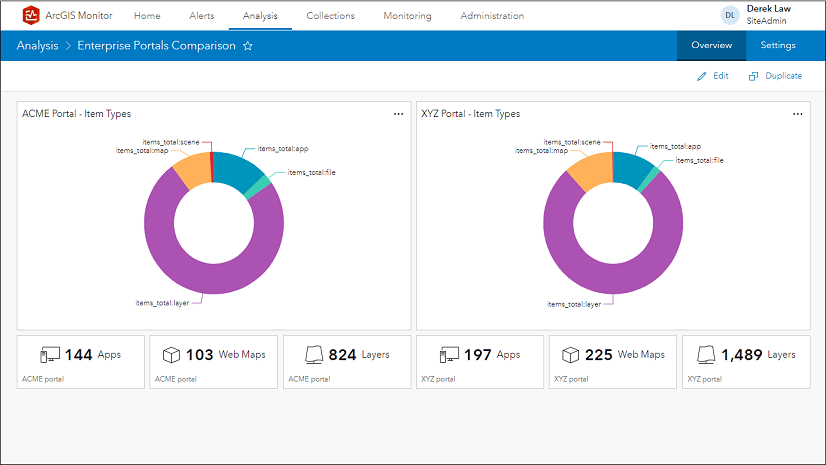
In a previous blog, the ACME Geoportal KPI analysis view was presented. It contained several analysis elements that showed key metrics for Enterprise portal content. This blog builds on the analysis view and demonstrates how to construct some useful indicators that provide insights on Enterprise portal performance metrics. Defining the data expression and how the element is configured are explained. The analysis elements discussed are:
- Federation health check alert
- Portal index check alert
- Memory utilized
- CPU utilized
- Storage used
- Storage available
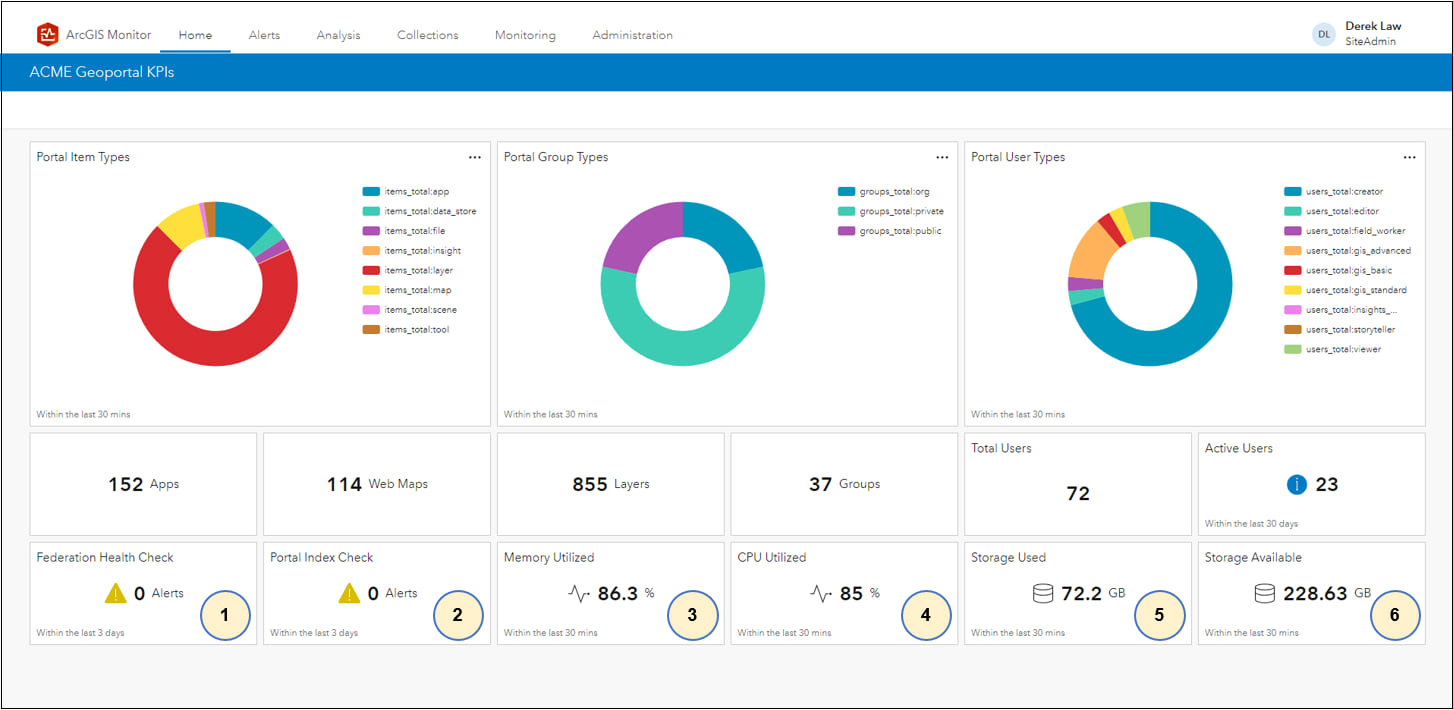
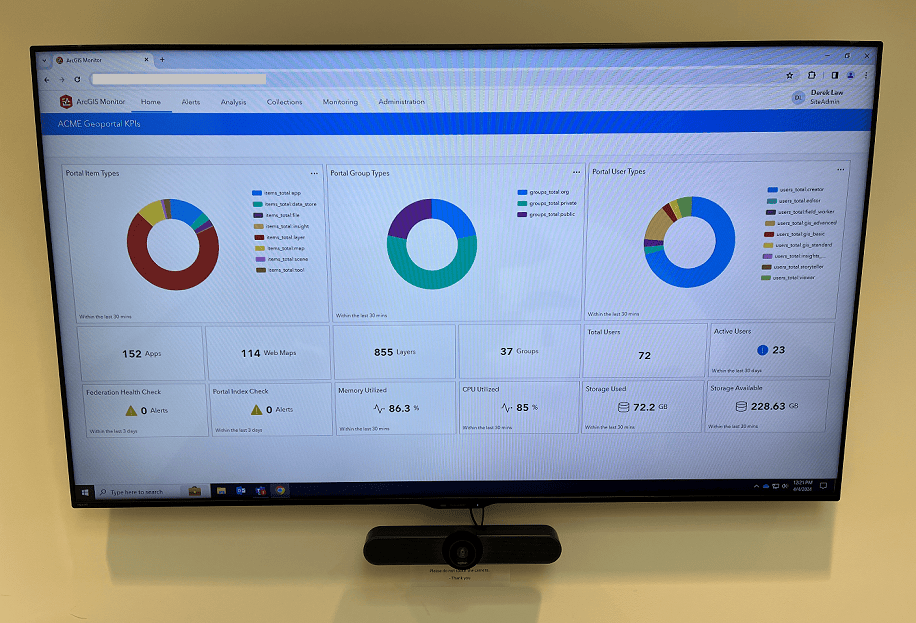
Configuring these analysis elements can yield the Enterprise portal analysis view below:
To configure these elements, you will need to register both the Enterprise portal and the host machine/VM that portal is running on. For the purposes of this blog, the Enterprise portal is named “ACME Geoportal” and the host machine is called “ACME portal host”.
FYI: when you register a host machine/VM with ArcGIS Monitor, this will also register a new storage component that represents the disk space. This can be found in Monitor under the Monitoring tab > All Components > Storage. You can identify the storage component that belongs to the portal’s host machine/VM, because it will have the same machine name. For the purposes of this blog, the storage component of the portal’s host machine is named “ACME portal – Drive C”.
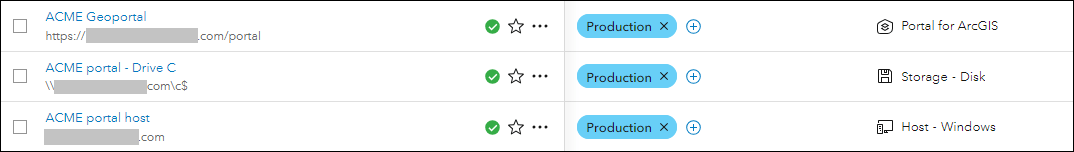
These three components: ACME Geoportal, ACME portal host and ACME portal – Drive C will be referenced throughout the blog when configuring the data expressions for the various analysis elements.
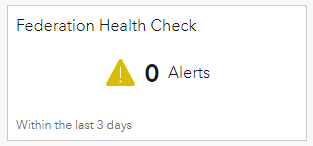
1. Federation Health Check Alert
When an ArcGIS Server site is federated with an Enterprise portal, it means that its security and sharing model has been set to portal’s authentication model. This is a configuration requirement for an ArcGIS Server site that serves as the hosting server for portal. An Enterprise portal can have multiple ArcGIS Server sites federated with it. Learn more about ArcGIS Server federation.
This indicator displays the total number of alerts that occurred for the federation health check property of Enterprise portal, for all federated ArcGIS Server sites, and within the last 3 days. This indicator helps an administrator be aware of any federation validation issues; having zero alerts means everything is working well. If there are alerts, it would be worthwhile to check for any potential federation issues.
The data expression for the Federation Health Check element,
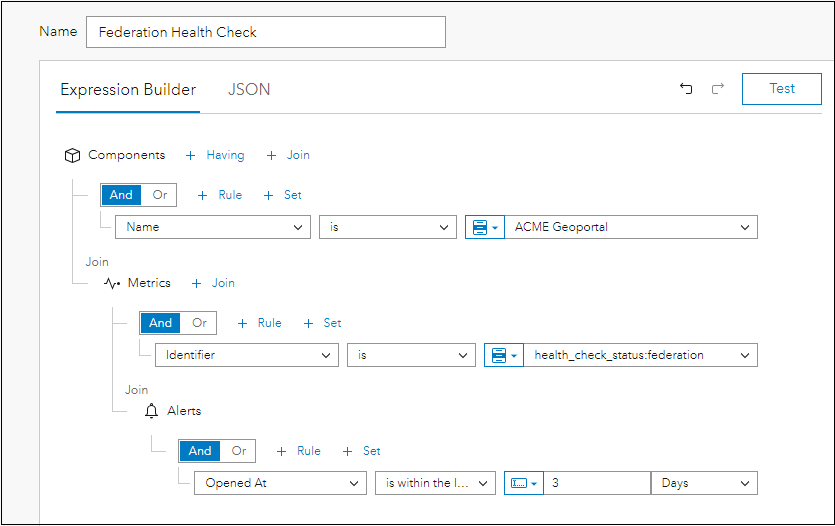
- Components where name is ‘ACME Geoportal’
- Join Metrics
- Identifier is ‘health_check_status:federation’
- Join Alerts
This will query for any alerts that were opened on the Enterprise portal federation health check property for all federated ArcGIS Server sites. The default alert setting in ArcGIS Monitor: a critical alert is opened when the value is less than 100%. - Observed At is within the last 3 days
Conceptually, you are building an expression that is querying information across three tables in the ArcGIS Monitor database: Components, Metrics, and Alerts.
The indicator element can be configured as follows:
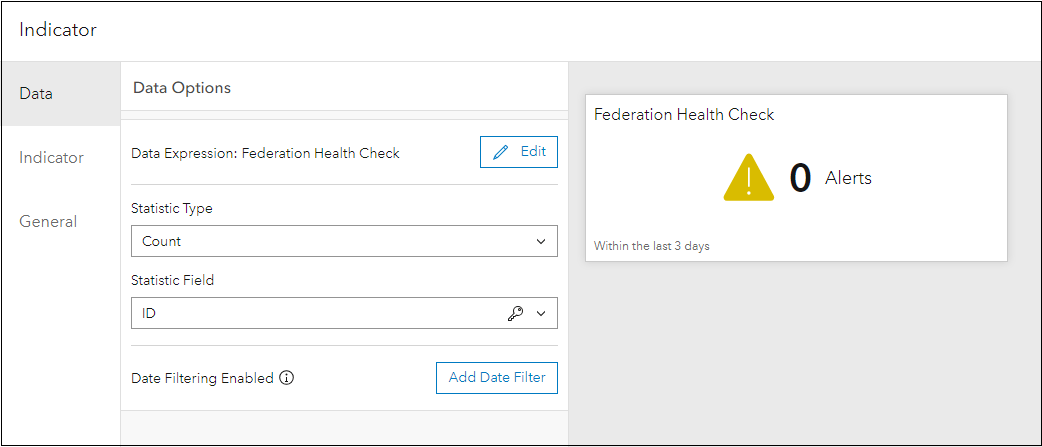
For Data
- Statistic Type is “Count” – this will display any alerts that were opened.
- Statistic Field is “ID”
For Indicator
- Value format is number
- For Suffix, input “Alerts”
- Select symbology
- Icon position on left
- Select the Status: Warning icon
For General
- Add a custom title for the indicator
- For Description input “Within the last 3 days”
2. Portal Index Check Alert

An Enterprise portal’s index counts the portal’s users, groups, and items – and ensures they are in sync. An out of date index will likely cause issues when searching for content in the portal. This indicator displays the total number of alerts that occurred for the Enterprise portal index property within the last 3 days. It helps an administrator be aware of any possible index issues; having zero alerts means everything is working well. If there are alerts, it would be worthwhile to check for any potential Enterprise portal index issues.
The data expression for the Portal Index Check element,
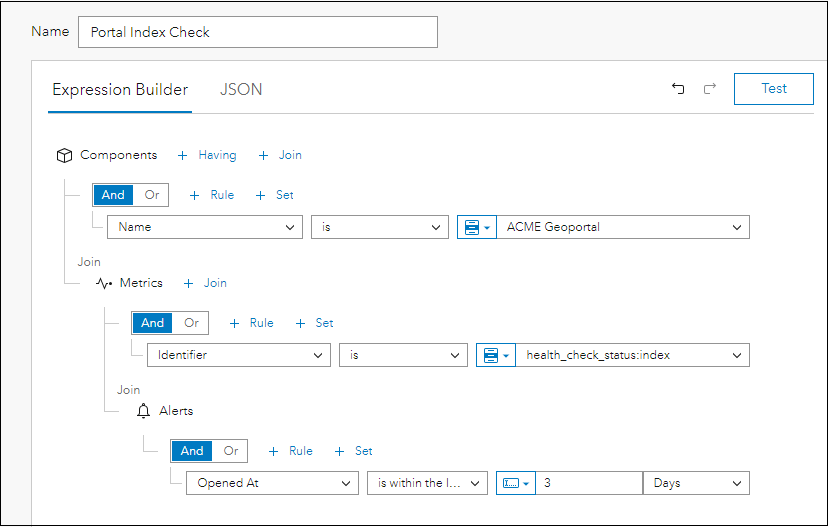
- Components where name is ‘ACME Geoportal’
- Join Metrics
- Identifier is ‘health_check_status:index’
- Join Alerts
This will query for any alerts that were opened on the Enterprise portal health check index property. The default alert setting in ArcGIS Monitor: a critical alert is opened when the value is less than 100%. - Observed At is within the last 3 days
The indicator element can be configured as follows:

For Data
- Statistic Type is “Count” – this will display any alerts that were opened.
- Statistic Field is “ID”
For Indicator
- Value format is number
- For Suffix, input “Alerts”
- Select symbology
- Icon position on left
- Select the Status: Warning icon
For General
- Add a custom title for the indicator
- For Description input “Within the last 3 days”
3. Memory Utilized
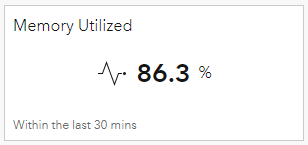
This indicator shows the Enterprise portal host machine/VM’s memory utilized as a percentage. This can help administrators keep track of the available memory on the host machine/VM. When memory usage approaches 100 percent utilization for long time periods, running processes may crash as they attempt to expand into additional memory space.
The data expression for the Memory Utilized element,
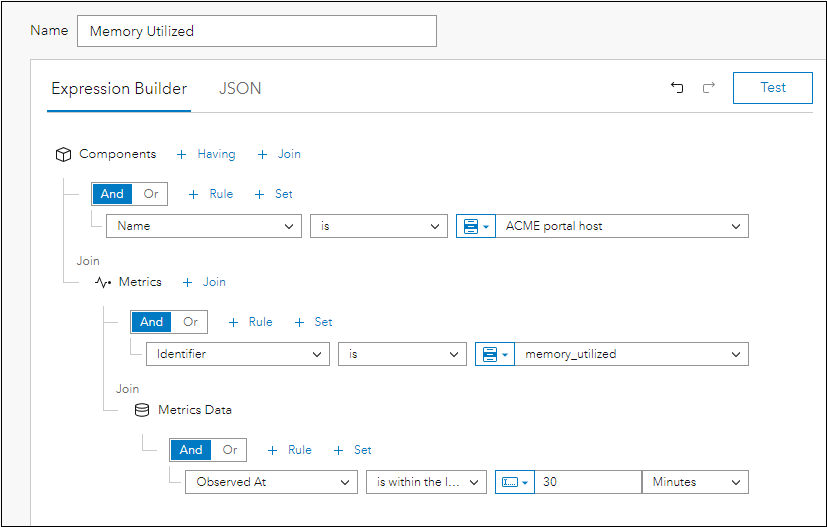
- Components where name is ‘ACME portal host’- This metric is a property of the host machine/VM.
- Join Metrics
- Identifier is ‘memory_utilized’
- Join Metrics Data
- Observed At is within the last 30 minutes
The indicator element can be configured as follows:
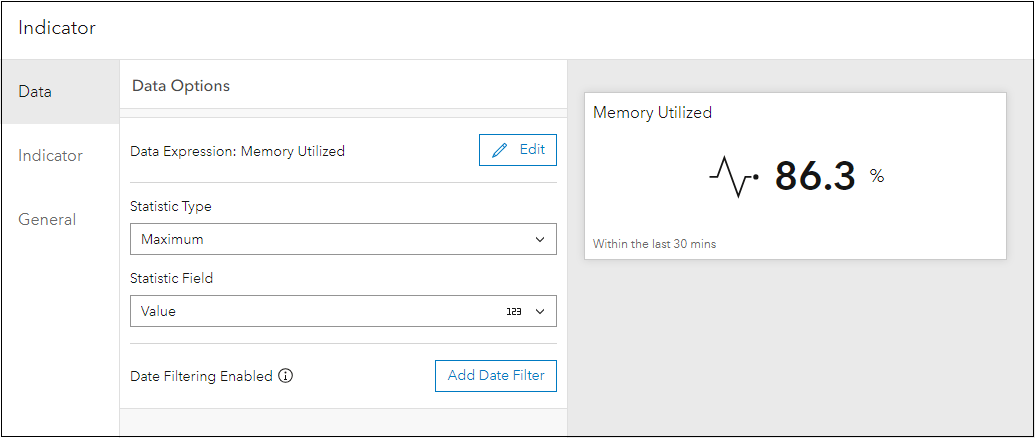
For Data
- Statistic Type is “Maximum”
- Statistic Field is “Value”
For Indicator
- Value format is number
- For Suffix, input “%”
- Select symbology
- Icon position on left
- Select the Metrics icon
For General
- Add a custom title for the indicator
- For Description input “Within the last 30 mins”
4.CPU Utilized
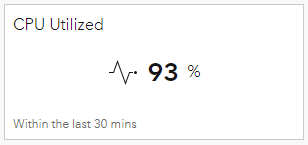
This indicator shows the Enterprise portal host machine/VM’s Central Processing Unit (CPU) utilized as a percentage. When the machine’s processor spikes or reaches 100 percent capacity, compute requests are backlogged, which may cause a delay in the return of information. This applies to any running process when experiencing a burst in activity. In turn, this could affect the performance of the Enterprise portal.
The data expression for the CPU Utilized element,
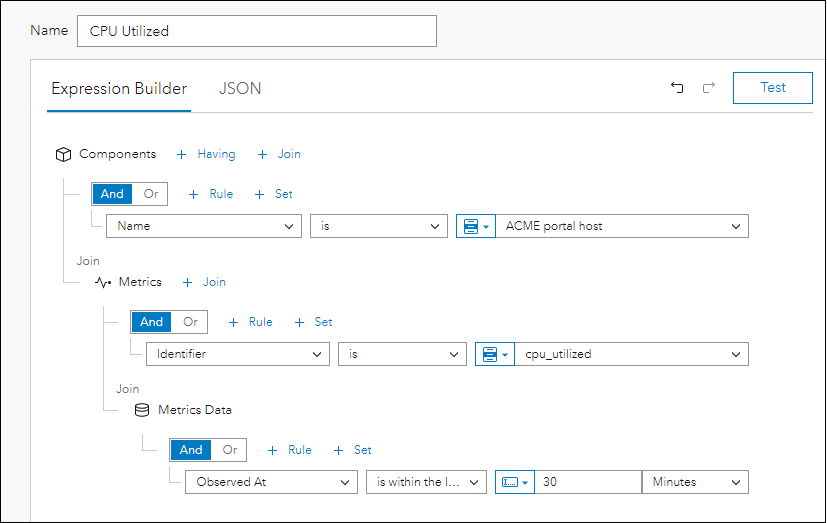
- Components where name is ‘ACME portal host’- This metric is a property of the host machine/VM.
- Join Metrics
- Identifier is ‘cpu_utilized’
- Join Metrics Data
- Observed At is within the last 30 minutes
The indicator element can be configured as follows:
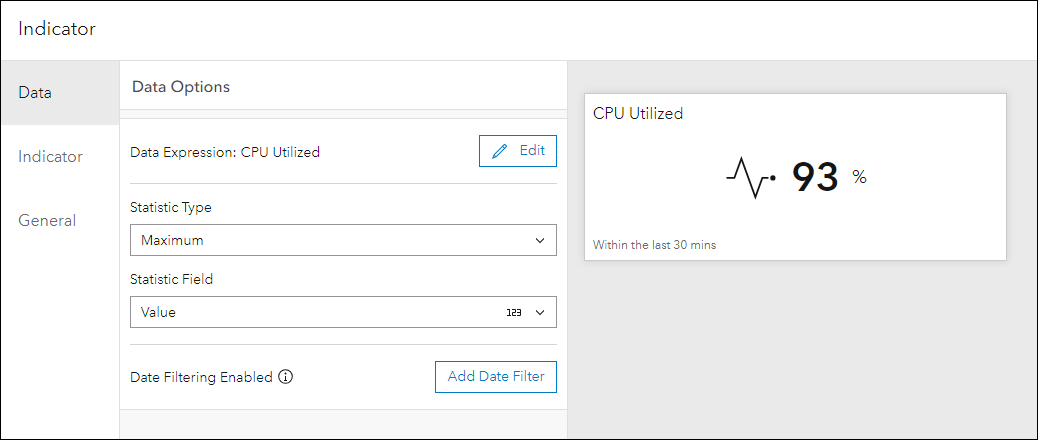
For Data
- Statistic Type is “Maximum”
- Statistic Field is “Value”
For Indicator
- Value format is number
- For Suffix, input “%”
- Select symbology
- Icon position on left
- Select the Metrics icon
For General
- Add a custom title for the indicator
- For Description input “Within the last 30 mins”
5. Storage Used
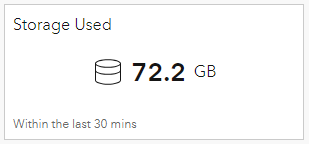
This indicator shows the Enterprise portal host machine/VM’s storage used in gigabytes (GB). This is a good property for an administrator to track so they are aware of the Enterprise portal file size and can monitor its growth.
The data expression for the Storage Used element,

- Components where name is ‘ACME portal – Drive C’- This metric is a property of the storage component.
- Join Metrics
- Identifier is ‘storage_capacity_used’
- Join Metrics Data
- Observed At is within the last 30 minutes
The indicator element can be configured as follows:
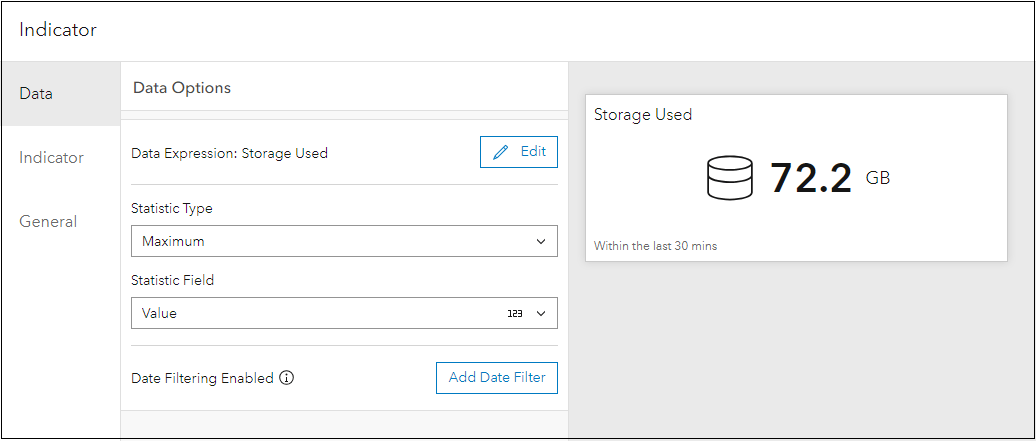
For Data
- Statistic Type is “Maximum”
- Statistic Field is “Value”
For Indicator
- Value format is number
- For Suffix, input “GB”
- Select symbology
- Icon position on left
- Select the Database icon
For General
- Add a custom title for the indicator
- For Description input “Within the last 30 mins”
6. Storage Available
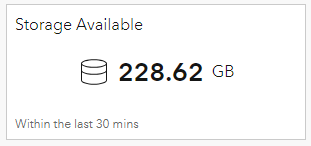
This indicator shows the Enterprise portal host machine/VM’s available storage size in gigabytes (GB). This informs administrators of the amount of storage space remaining. Low disk space on the disk drive or drives hosting an Enterprise portal’s installation or log directories affects performance and can impede some site operations. Learn more about disk space monitoring for Enterprise portal.
The data expression for the Storage Available element,
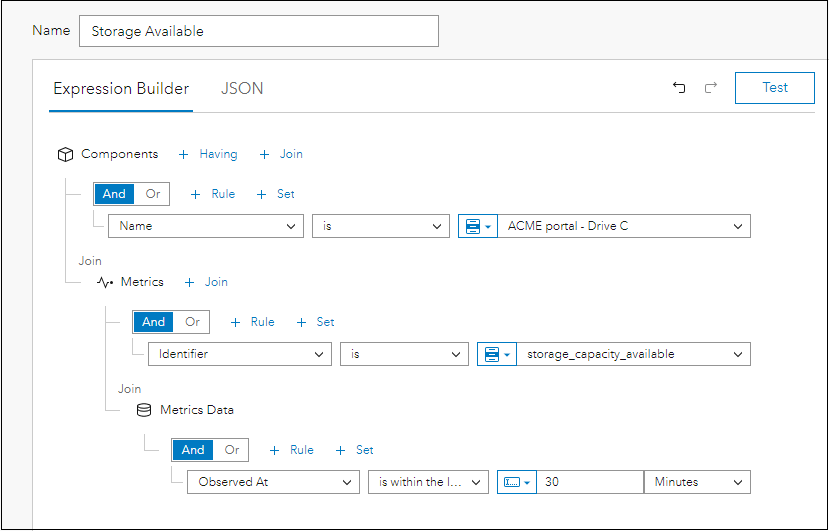
- Components where name is ‘ACME portal – Drive C’- This metric is a property of the storage component.
- Join Metrics
- Identifier is ‘storage_capacity_available’
- Join Metrics Data
- Observed At is within the last 30 minutes
The indicator element can be configured as follows:
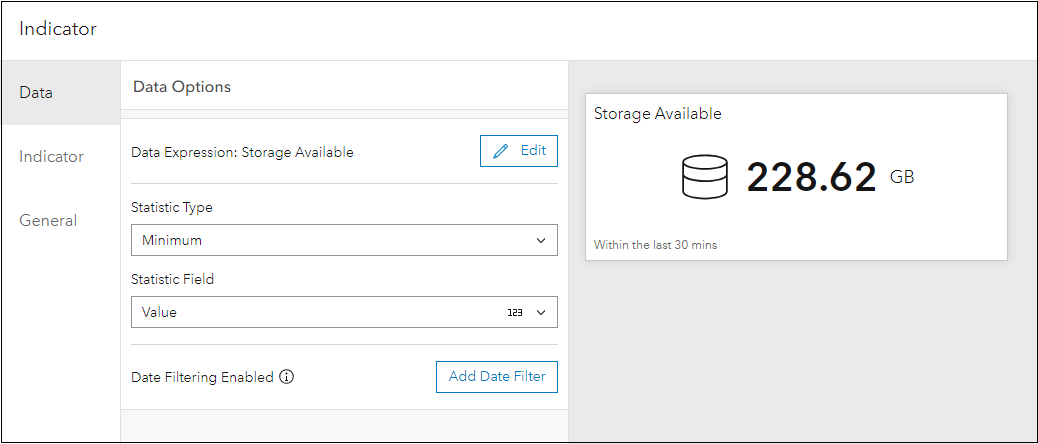
For Data
- Statistic Type is “Minimum”
- Statistic Field is “Value”
For Indicator
- Value format is number
- For Suffix, input “GB”
- Select symbology
- Icon position on left
- Select the Database icon
For General
- Add a custom title for the indicator
- For Description input “Within the last 30 mins”
ACME Geoportal KPI Analysis View
The analysis elements discussed in the previous blog and this blog, enables administrators to report the contents and performance metrics of an Enterprise portal in ArcGIS Monitor. This provides more visibility and insight into how the Enterprise portal is being used by the organization. The analysis view could be displayed on a mounted screen and real-time metrics on portal activity can be shown:
Some additional resources,
- Monitor ArcGIS Enterprise help topic
- ArcGIS Monitor help documentation
- ArcGIS Monitor: An Introduction – Esri UC 2023 tech session video
- ArcGIS Monitor: Operational Scenarios – Esri UC 2023 tech session video
- Esri Community
Sincerely,
The ArcGIS Monitor team


Article Discussion: