Today we are announcing that with the March release of ArcGIS Online, Operations Dashboard for ArcGIS will be renamed to ArcGIS Dashboards.
If you’re familiar with Operations Dashboard for ArcGIS, you know that it can be used to build dashboards using maps, charts, gauges, lists, and more. Thousands of new dashboards are published monthly and the use cases for dashboards has expanded rapidly.
When Operations Dashboard was first released in 2013, the goal was to give users a tool to help them gain a real-time operational view of people, services, assets, and events. Dashboards are vital for situational awareness and users have experienced success using these information products in their day-to-day operations. Dashboards have been used to aid search-and-rescue efforts after natural disasters and improve safety at large public events, among other things. The role these dashboards play is a vital one.
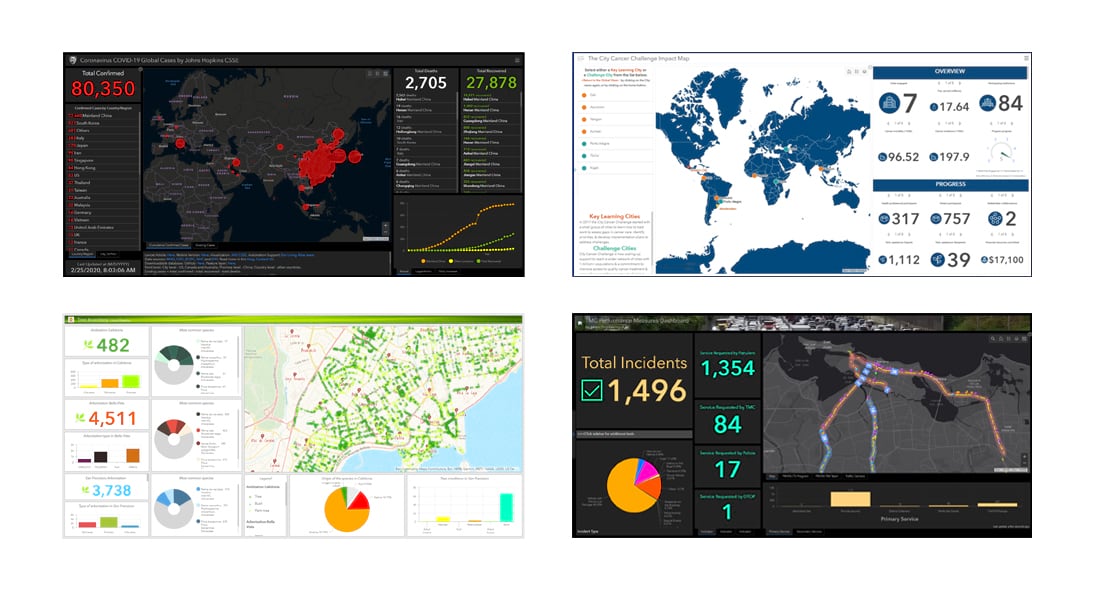
Dashboards are a natural fit for operational use cases, but users have been leveraging dashboards for so much more – performance management, status monitoring, executive briefings, impact assessment, and informal information sharing, to name a few (explore examples here). They’ve been utilized in many different industries and for many different purposes, whether those be strategic, tactical, operational, or informational. At the highest level, dashboards convey information by presenting location-based analytics using intuitive and interactive data visualizations on a single screen. Dashboards are easy to understand, flexible, and interactive, easily built and understood by anyone.
Every organization using ArcGIS can use ArcGIS Dashboards to help make decisions, visualize trends, monitor status in real-time, and inform their communities. Authors tailor dashboards to their audiences, empowering them with the information they want and the ability to slice the data to get the answers they need. Audiences range from the general public to GIS analysts and line-of-business managers, all the way up to the C-suite. The possibilities are wide-ranging, and because of it, the name ArcGIS Dashboards better suits the product going forward.
Behind the scenes, the product will remain the same. Use ArcGIS Dashboards to build a dashboard that takes advantage of the data you have, using a rich set of data visualization tools. Configuration is straightforward, enabling all users within an organization to create dashboards, just as they would maps and apps. Try it out today and keep your eye out for the upcoming name change. The change will also go into Enterprise 10.8.1.
Find us at Esri Developer Summit 2020
Come talk to us about ArcGIS Dashboards at the Esri Developer Summit in Palm Springs March 10-13. The team will be at the ArcGIS Online island within the product showcase, ready to answer your questions and explore the dashboards you’ve built. In addition, we have three technical sessions where you can learn more about what’s coming with ArcGIS Dashboards.
- ArcGIS Dashboards: Tips and Tricks – Wednesday, March 11, 10:30-11:00am https://developersummit2020.schedule.esri.com/schedule/1938089274
- Arcade in ArcGIS Dashboards – Wednesday, March 11, 11:15-11:45am https://developersummit2020.schedule.esri.com/schedule/1843425434
- The Road Ahead: ArcGIS Online – Thursday, March 12, 4:00-5:00pm (in this session, we will discuss the road map for ArcGIS Dashboards) https://developersummit2020.schedule.esri.com/schedule/2122210783
Share your dashboards with us
If you build a dashboard using ArcGIS Dashboards, be sure to share it with us on social media using the hashtag #ArcGISDashboards. We love seeing what our users create and we’re in the process of building a user gallery of dashboards to showcase on our website.
See you soon,
-The ArcGIS Dashboards Team
Helpful Links:


Article Discussion: