Dashboards are great for presenting high-level information for quick digestion. Visual elements such as indicators, gauges, and charts excel in this with their simplicity and ability to communicate status and trends at a glance. In some dashboards, a higher degree of precision and quantity of information is needed. That’s where tables can be useful.
If you are new to the table element, check out this blog to get up to speed. In the following sections we will walk through several tips for using Arcade expressions to get the most out of your tables through advanced formatting. To illustrate the concepts, I will be using summarized parking data and pothole repair request data to create tables serving various purposes on dashboards. You can use these data sets to try these concepts for yourself.
The Basics
Out of the box, you can configure powerful tabular displays of raw data, however, sometimes you might need to go beyond. For that, you can enable Advanced formatting in the Values tab to create an Arcade expression that allows you to apply custom logic to format the values and cells in the table.
The expression, which is executed for each row in the table, is used to define the content and formatting for each cell. Data point attributes can be referenced using the $datapoint global variable in the Arcade editor. The cells dictionary must have a property for each field defined on the Data tab of the table’s configuration. For more information, see the documentation.
Value Formatting
The displayText property controls the content of the cell. Once advanced formatting is enabled, you will format numbers and dates using Arcade. The Text() function is great for dialing in dates, rounding a number to the nearest whole number, or including currency symbols and negative value formatting.
By including a semi-colon, you can define a negative value pattern after it. Having the currency symbol in the number pattern null values will result in a blank cell for null values (as opposed to a “$” in the cell).

The value can be plain text or HTML. For example, hyperlinks can be displayed by returning an anchor tag between a backtick (`) and referencing in variables into the template literal. You can also apply text formatting such as bolding or color using a span tag.

Category Overrides
In a grouped values table displaying categories, you may need to override some strings that are too long or not so user friendly. The Decode() function allows you to easily do that.

Highlight Values
Highlighting allows you to draw attention to values of importance or concern in your table. The backgroundColor property and textColor property allow you to do just that. For example, you may want to color negative numbers red or highlight descriptions containing keywords.
Then, reference the colors for textColor and backgroundColor in the dictionary returned.

You can also highlight cells based on simple color ramps to guide the viewer’s eyes to easily identify small and large values. Use a When() function to define colors for ranges of values and reference the color variable in the backgroundColor of the cell.

Highlight a Row
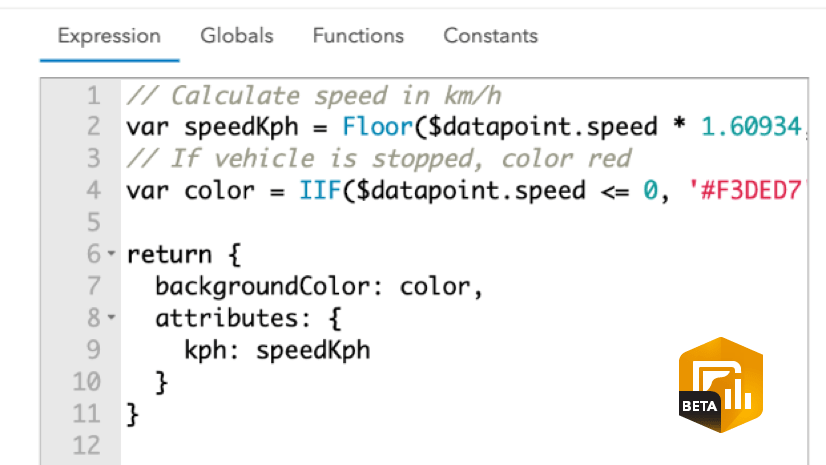
To highlight an entire row, you can restructure the expression to first define a dictionary for the row, then override properties of it. You can conditionally define a color based on some logic and loop through each cell to set the backgroundColor.

Mark Cells with Icons
Icons are another visual option to draw attention to a value. You can add icons to the cells of your table using an expression. First, you need to add an icon at the bottom of the Values panel and give it a name.
This icon can be rendered in a cell of the table by referencing it by its name for iconName. To display it under a certain condition, you can use the IIF() function. If the icon name provided is not found, like for an empty string (”), an icon will not be displayed.
Icons can also be used to visually distinguish categories (whether on a feature table or grouped value table). Return the category field global as the iconName and add icons with names aligning with the values in the data.
Another way icons can be used is to align the color to that of the map symbol colors. Use the Decode() function to define a color.
Hover Text
You can enable hover text in the Table tab and return a hoverText property for each cell. This can allow users to see more detail or read the full text of a long description that gets truncated in the table. If hover text is not desired for certain cells, return an empty string for the hoverText property.


Summary
Tables can be an effective way to summarize and lookup data in a precise, condensed way. Using advanced formatting there are many options for drawing attention to important information and supporting at-a-glance information sharing and decision making.
To see these techniques in play, check out this parking dashboard. Make a copy of it to see the Arcade expressions in edit mode.

You can also check out this pothole repair request dashboard and make a copy of it.

We’d love to see your creative use of tables and your own tips and tricks for advanced formatting. You can share them on social media with #arcgisdashboards.


Is this on the roadmap for Enterprise Portal? We are currently on version 10.8.1. Thanks!
The Table element was included in ArcGIS Dashboards in Enterprise starting at 11.0.
If I have category selectors that are filtering my table, can I use arcade to only show fields that have data, hiding the fields that do not? This would need to dynamically update to the respect the filters applied by the category selectors. Thanks for the insights!
Good question. The table will always display all columns/fields chosen in the Data tab. If you omit a field in the dictionary returned from the formatting expression, it will show a blank cell.