Twenty minutes south of Ann Arbor, Michigan, the City of Saline serves over 8,000 residents with water, wastewater, and stormwater utilities. A historic city, Saline’s three systems have their roots in assets first installed over 100 years ago. And as director of the Department of Public Works (DPW) Larry Sirls will tell you, until recently, the city’s record-keeping system seemed about as antiquated.
“We had what I call a ‘somewhat map,'” Sirls said.
Before Sirls came on board, the city’s plot plans, as-builts, work orders, and other records were stored in various facilities in the form of paper and notebooks. Like any fiber product, the paper was vulnerable to the age-old perils of fading, tattering, and becoming water damaged.
“The system worked, as long as the paper didn’t blow out the window,” said Maintenance Technician III Joel Radenbaugh.
The city was also paying for a geographic information system (GIS), which organized and displayed information geospatially, but a third-party firm managed it. That meant none of the city’s employees had access to it, and every map was produced at a cost. That all changed when Sirls came on board two years ago. In his previous life, Sirls had worked at an organization with a comprehensive and digital in-house GIS. So he knew the power of consolidating, digitizing, and georeferencing utility data into a high-confidence GIS that could drive efficiencies. That was the vision he pitched to management.
Choosing the Right Team and Technology
First, Sirls recommended the city regain control of its GIS. He proposed not only that Saline bring its GIS in-house, but also that it digitize decades of paper as-builts. Since the city was already using Esri’s ArcGIS, and Sirls was familiar with using it, it made sense to stick with ArcGIS. To guide the project strategically, Sirls brought in Esri partner OHM Advisors, an approved city contractor and Michigan-based consultancy proficient in both utility and GIS services.
“Once I had a budget and the right team, we went to work,” Sirls said.
Enriching the Legacy Basemap
When the city brought the GIS in house, it inherited a legacy basemap. But it quickly became clear that the assets on this map could not be trusted. So the team implemented two plans to increase the accuracy of the data.
First, it brought in 20-year Saline veteran maintenance worker Radenbaugh to digitize paper records—all of them, including some dating back over 100 years. Next, for each as-built scanned, a GIS intern would create a polygon feature representing that site in the GIS and hyperlink it to the scanned documents stored on a cloud server. With the as-builts now associated with the map, Radenbaugh could then review each site and use his institutional knowledge to identify discrepancies between the records and the real world. OHM Advisors created a web mapping application for Radenbaugh to mark up these discrepancies.
“After years of doing fieldwork, now I’m going back over all these old documents,” Radenbaugh said.
Based on the markups, they could send a fieldworker from either the city or OHM Advisors to validate that an asset had indeed been removed from the field.
“Using Field Maps, we verified removals as well as whether asset locations were spatially accurate, based on the map change-request points placed by Joel,” OHM Advisors project manager Jake Murawski said.

In addition to these targeted resolutions, OHM Advisors also proposed completing a mass data capture of all three systems.
We knew that the locations of the assets in the basemap could be inaccurate. Given everything had been digitized from paper, it wasn’t uncommon to have assets in the wrong place, like a hydrant being placed on the wrong side of the street. So we proposed to do a full data capture.

Completing a Mass Data Capture
The City of Saline DPW wanted to start with water and sewer systems since the assets were usually near each other, which meant the team could make fewer trips to the field. Then, it would go out and do the stormwater system.
To collect and update data in the field, OHM Advisors and the DPW set up a dedicated field data collection map within Esri’s ArcGIS Field Maps. Field Maps is a mobile mapping app that sends data from the field to the office. It works on both iOS and Android devices, which meant all fieldworkers could use their phones or tablets to collect data. It also works offline, allowing workers to record data on their devices and sync to the cloud once they reentered a service area. But one of the best-used features of Field Maps is its configurability; this allowed the team to standardize the data coming in. Not only would the crews update the physical locations of the assets, but they could also perform visual inspections and collect related attribute information, such as gate measurements, manufacture date stamps, and photographs.
To ensure locations were extremely accurate, OHM Advisors recommended the DPW invest in a high-accuracy GNSS receiver. After considering various options, the city purchased the Arrow Gold® Global Navigation Satellite System (GNSS) receiver from Esri partner Eos Positioning Systems. Manufactured in Canada, the Arrow Gold receives real-time differential corrections from the Michigan Department of Transportation (MDOT) Continuously Operating Reference Station (CORS) Network, enabling it to stream real-time centimeter locations to both iOS and Android devices. The ease of use of the hardware and software was a big factor in why the DPW chose to use Field Maps and the Arrow Gold.
It all starts with the fieldworkers. If the fieldworkers think the technology is too hard to use, then that lack of trust works its way up the chain of command and comes back down. So any solution that was going to work for Saline needed to support the fieldworkers first.
Because Field Maps supports the Arrow Gold receiver’s GNSS metadata, it was also captured in the field and sent back to the office. This enabled OHM Advisors to perform a quality check on all incoming field data before folding it into the authoritative GIS, to identify any location quality issues immediately.
“We can look at the GNSS metadata collected by each fieldworker, then go back to them and make sure their settings and workflow are correct,” said Michael Cousins, an OHM Advisors partner and GIS practice leader. “This way we can correct any issues before it is too late and ensure that we are collecting the highest-quality data possible.”
The field data collection project started with just two city staff, but as the GIS became more in demand, OHM Advisors added two of their own staff to accelerate the data collection.
“The city had by this point started to rely heavily on the GIS,” Murawski said. “So we stepped in to increase the field personnel to map these two systems more quickly.”
Benefits Abound All Around
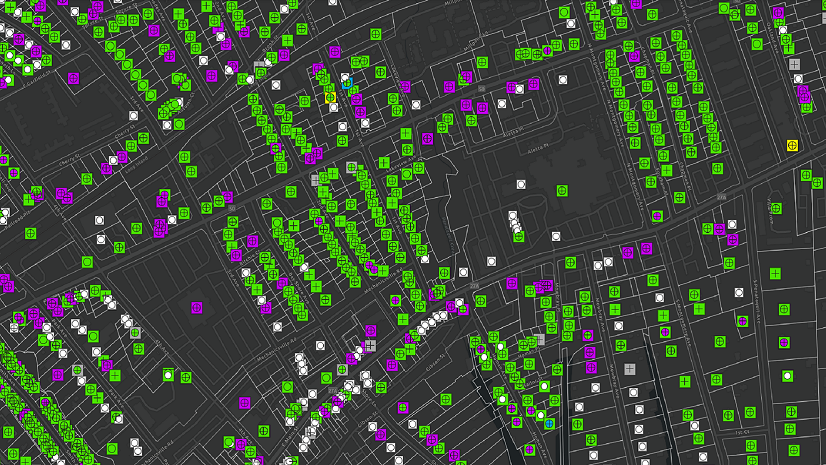
To date, the water and sewer systems have been largely mapped, and the stormwater system is next. Every DPW employee can now access the definitive GIS data in the field using Field Maps and back at the office using a custom Esri ArcGIS Online map—a huge leap from two years ago when no one had access—and benefit from it.
Plant workers can sign in and view asset information without having to drive to another facility to find a paper record.
“They’re not having to send scans of plan sheets anymore,” Sirls said. “They’re using GIS.”
Similarly, fieldworkers can view system blueprints without having to go back to the office by accessing the scan via hyperlink back to the cloud server.
“When the data is in the basement or at another building somewhere, you’re never going to find it,” Radenbaugh said. “Now it can live forever, in your hand.”
Meanwhile, new employees use the GIS to quickly come up to speed about asset histories, helping them make more informed decisions when encountering new scenarios, such as responding to a main break.
Some new guys have been here six months, so they haven’t done a main break yet. But by having a phone with a map in it, they can get called in at night and go right to the correct valves in the field. They’re not sifting through handwritten notes to find what they need.
The same is true for veteran field crews who, instead of relying on paper records during a main break, can navigate directly to a shutoff valve instead of having to guess at its location. This saves water, reduces damages, and mitigates customer impact during repairs.

“We might know a midnight main break has happened when we see the pavement heaved, so we close the street down,” Sirls said. “But now we also know exactly where our utilities are, so within minutes we can isolate the area. Before, it could take you an hour to go back to your truck, find someone’s handwritten notes, or back to the yard to find prints about where the valves might be, and try to find it in the field. And all of that depended on if you could find the right one.”
Sirls’ team can also respond to any administrative map requests right away, at no cost, without having to go through a third party.
“Before, it took a while and we double-paid,” Sirls said.
The team has also created a holistic view of the systems, which allows more diligent maintenance. So far, by digitizing all the water and sewer records dating back to 2015, Radenbaugh has been able to identify sections of the systems that are past due for regular maintenance.
“Every four to five years we should have the whole town done,” Radenbaugh said. “So looking back at these records, I can see that we’ve missed some sections of town. Now we can fix that.”
In addition to needed maintenance, the city can also cut down on unnecessary use of its infrastructure. By modeling the hydraulics of the sewer system, for instance, it can cut down on inflow (when water such as rainwater enters the sewer from aboveground points) and infiltration (when groundwater seeps into the sewer system via weak spots, such as cracks, in the underground pipe). Known as I&I, inflow and infiltration increase the volume of water the city must treat. Reducing I&I can save the city money.
“Any time you’re treating rainwater as sewage, you’re losing money,” Sirls said.
According to Esri account executive Christian Freed, who began working with the DPW in 2023, the city’s work has set it up for long-term success in both employee efficiency and customer service.
“I applaud Larry Sirls and the City of Saline for the incredible efforts put forth thus far in modernizing the way they operate,” Freed said. “Work is just plain better when you’re not running around trying to track down resources and records. This technology will help the Department of Public Works serve their community more efficiently, ultimately making Saline a better place to live and work.”
The benefits extend not only to field crews and customers, but also to key decision-makers.

Dashboards for Decision-Makers
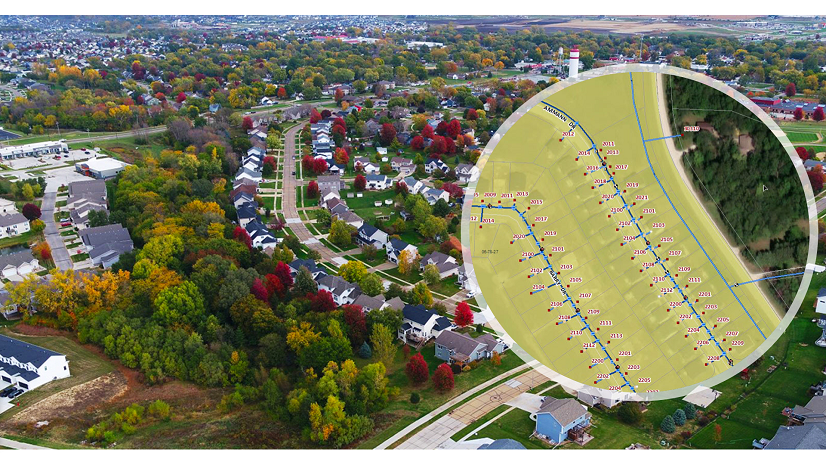
OHM Advisors set up multiple dashboards created with ArcGIS Dashboards, which summarize specific information from the GIS into geospatially visualized project overviews. They also created a custom, internal web page using ArcGIS Experience Builder, where staff can launch any dashboard to view specific project summaries.
One of these dashboards tracks sanitary jetting, a maintenance task given to contractors. In the past, contractors were given approximate footage, but because the as-builts weren’t highly accurate, the project could end up costing more than budgeted. Now, with the GIS, the city can provide more accurate estimates and reduce unexpected costs.
“In the past, the scope of work could be severely inflated or deflated,” Cousins said. “By [using GPS for] all the structures and updating the mains, now our numbers are a lot closer to reality in terms of footage.”
According to Sirls, another benefit of giving contractors geospatial information is that they have transformed the turnaround time for contractor deliverables. Previously, contractors submitted thumb drives of PDF logs of their work. Now, contractors are given a copy of the geodatabase containing specific information pertinent to their project, and they are expected to populate the geodatabase and return the data in geospatial format. After a quality check, this information is folded directly into the GIS by OHM Advisors.
“Not only do we get a fast turnaround, but we can also view all of the sewer segments with color coding according to rating,” Sirls said. “In the past, a lot of time and money was spent due to the data simply not being geospatially enabled and accurate. Now, they populate their work, send it back to me, and I drop it into the GIS immediately. No more thumb drives.”
The contractors themselves also benefit from the geospatial information. In the past, a contractor tasked with maintenance hole inspection could arrive on a street with 10 maintenance holes and have to figure out which one he was meant to inspect.
“Now, he can walk right up to the correct [maintenance] hole,” Cousins said. “It’s not just time and money that are saved. This also helps get the work done.”
Meanwhile, the Hydrant Maintenance dashboard summarizes work that night-shift workers do on hydrants. Because hydrants are worked on as overtime, the workers can change nightly.
“When someone new comes in, they can look at that dashboard, see what was done the previous night, and pick up in the right spot,” Radenbaugh said. “There’s no having to go back and redo a bunch of work.”
Hydrant information is also shared with local firefighters, who can use it to navigate more quickly to an appropriate hydrant.
The Water Main Break dashboard summarizes live crew locations, a repair log of each main break, and which assets were inspected. This allows decision-makers to start to see trends in the major causes of main breaks, whether it’s a natural catalyst, contractors hitting a service line, or another factor.
The Holy Grail: Looking Toward a Utility Master Plan
According to Sirls, his ultimate goal in building this GIS is to create a utility master plan. Required by the Michigan Planning Enabling Act (MPEA) of 2008, a utility master plan is a mandate requiring communities to provide records of their utility systems and related information every five years, while performing internal reviews annually. Among the MPEA’s many goals, streamlining capital improvement programs and driving stronger development decisions are key.
“The utility master plan and GIS go hand in hand,” Sirls said. “In order to receive accurate bids and deliverables from contractors, we have to know what we have, how much of it, and where it is. The biggest challenge I had before is that we just didn’t have a place where we were storing this data, which I need to effectively program jobs. Now we’re getting there.”
We finally have a way to manage our data, so we can start to budget better. We want an accurate budget so we can make the best investments. We don’t want a best guess.
The master plan will allow the utility to thoroughly analyze its system, its weaknesses, and its budget—and get ahead of repairs and rework. Sirls anticipates the GIS will help the city start planning out its public works investments for years into the future.
“Think about just the sewer system. With the GIS, we can backload rehab methods and unit costs, and we can actually use this data to budget out our whole 50 years forward of owning a sewer, which is pretty amazing,” Sirls said. “If we can project 50 years out from now, then—as much as possible—we can guarantee the entire system is going to be properly reinvested into and sustained with minimal unscheduled work. And the beauty is, anyone can do this.”
Stay Connected with Esri’s Water Team
ArcGIS is an extensive information system that enables modernization of workflows with easy-to-use applications for the field and office. Strengthen your organization with smart water solutions that will increase efficiency and provide insight for decision-makers. Visit the Esri Water Utilities web site for more information.
Join the Water Utilities Community
Follow #EsriWater on social media: Twitter | LinkedIn
Subscribe to the Water Industry newsletter “Esri News for Water Utilities and Water Resources“
Learn more about how GIS supports digital transformation.