Using a location strategy can help your organization decide which programs to implement, resource allocation, and where funding should go based on need. Before coming to Esri I was also an equity practitioner who leveraged the power of GIS technology to tell me what communities were underserved and in most need through nonprofit work and local government. Making the connection between equity initiatives and a geographic approach allowed me to develop a GIS-based strategic equity plan.
A GIS-based strategic equity plan outlines four steps organizations follow to ensure an equity lens is applied to all their workflows. It overlays internal and public data to better understand your community, creates a location strategy based off needs identified, operationalizes the strategy, and monitors the strategy’s progress in real-time. In the ongoing webinar series I am hosting Build Your Strategic Equity Plan with GIS Esri subject matter experts and leading organizations guide attendees through the strategic equity plan. I believe all organizations, private or public, benefit from adopting a geographic approach as it allows them to identify and prioritize communities with the most need.
Since we are approaching the halfway mark of the webinar series, I wanted to share what we have learned so far:
Sentara Health
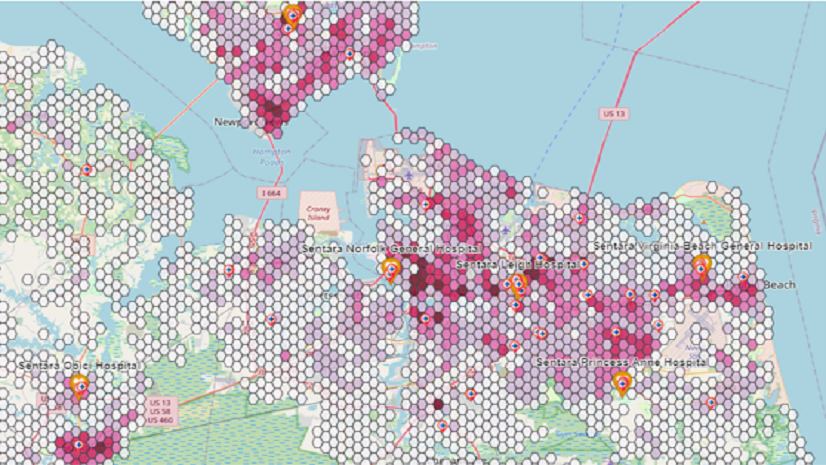
Iris Lundy, Vice President of Health Equity at Sentara Health, joined our first webinar to review how her team is creating change and increasing access to care in their communities by adopting a geographic approach. Lundy reviewed how the need for preventative measures was brought to her attention as the health system was experiencing high emergency department utilization rates. Lundy wanted to ensure that the communities they serve had resources and programs in place that helped them lead healthy lives. When she mapped out where the emergency department use was, they found the communities identified were lacking easy access to healthy food options.

Lundy relied on the GIS staff to tell her where to implement new resources such as food banks and then worked with community organizations to operationalize this work. Due to GIS technology Sentara Health is leading health equity work for all organizations to follow. However, we understand not all organizations are ready to operationalize their equity plans and must first look to location data to understand their community’s needs.
Understanding Your Community
Mapping and overlaying data such as income levels, demographics, access to care and affordable housing exposes patterns of inequity throughout our communities. Understanding your community’s needs is essential in ensuring underserved communities are prioritized, which is why this is the first step in developing an equity strategic plan. I invited Diana Lavery, Esri senior product engineer, to the webinar series so she could demonstrate the power of overlaying data to visualize where inequities are occurring.
“You start by building a map for understanding a community, but the goal is to create a map for decision support,” Lavery said, and I couldn’t agree more. Diana is part of our ArcGIS Living Atlas of the World team, our collection of geographic information roam around the globe. The living atlas includes public maps, apps, and data layers to support your work. I wanted Diana to highlight this content as it is available to all Esri users. You do not need to build or collect your own GIS data if you do not have the capacity to do so; the living atlas allows you to tap into data, reviewed and vetted by Esri staff.
Some of the data sets include the CDC Social Vulnerability data, American Community Survey data, Justice 40 layers, County Health rankings and more. Many of these data layers are updated every month and there are several real time updates.

Diana also demonstrated Esri Maps for Public Policy, a site of curated content training, best practices, and datasets that can provide a baseline for your research, analysis, and policy recommendations. While Lavery reviewed the various maps for public policy a question arose from attendees asking about data around the unhoused population in the US.

Lavery demonstrated the above layer found in Esri Maps for Public Policy which was collected by local continuums of care during the annual Point in Time count. This is a perfect example of how organizations combine national level data with their own data collected. This is also an acknowledgement that not all data is perfect however, it can still be used to understand your community and is an opportunity to incorporate community feedback and qualitative information into your work.
The Series Continues
We welcomed the new year with our second webinar in the Create an Equity Strategy webinar series. Thank you to Diana Lavery from the ArcGIS Living Atlas of the World, for walking through various examples of equity data and how to use the data to understand your community. Understanding your community is just the starting point, the goal is always to utilize your maps for decision making support. This leads us to our next step, creating a location strategy. Please join us on April 3rd where the City of Tacoma Washington guides us through how they leveraged the power of location to enhance equity with a location strategy.