The Greater Johnstown Water Authority (GJWA) has been providing high-quality drinking water to its customers since it was incorporated, under the Municipality Authorities Act, in 1964 by the City of Johnstown and Boroughs of Westmont and Southmont as a joint municipal authority. At the time of incorporation, GJWA acquired all the assets of the Johnstown Water Company and the Saltlick Water Company. Since its creation by a special Act of Assembly in 1866, the Johnstown Water Company had provided water to the inhabitants of the Johnstown area and had a strong link with the growing steel industry.
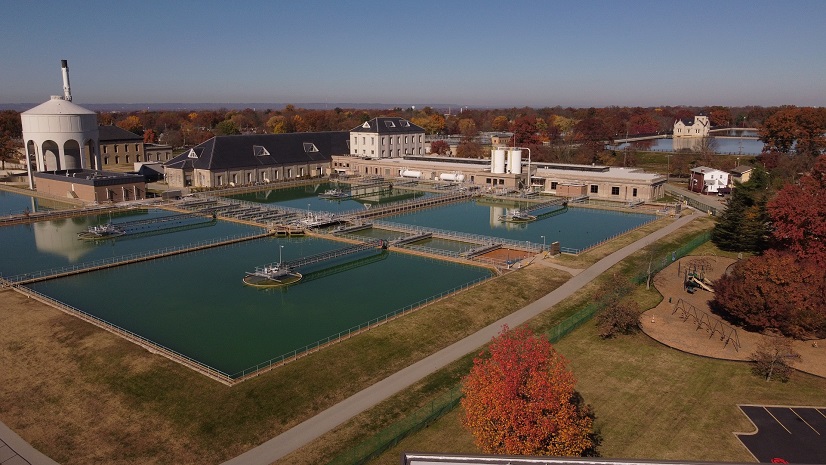
GJWA operates three dams, one well, two water treatment plants producing a combined total of 19 million gallons per day (MGD), and numerous tanks and pump stations, maintaining over 315 miles of potable water transmission and distribution mains that serve over 21,000 residential, commercial, and industrial customers. In addition to drinking water, GJWA also serves over 10,500 customers within the Johnstown region with sanitary sewer collection and maintains over 120 miles of sanitary sewer pipes. With over 435 miles of underground utilities in a 32-square-mile service area, GJWA needed an in-house solution to maintain information and location of all of these assets. A geographic information system (GIS) was the solution, and Esri’s ArcGIS Online was chosen to begin the journey.

Meeting Regulatory Requirements
In 2021, the US Environmental Protection Agency (USEPA) concluded that there are significant opportunities to improve the Lead and Copper Rule Revisions. It intends to promulgate these Lead and Copper Rule Improvements prior to the Lead and Copper Rule Revisions’ October 16, 2024, deadline. In preparation, GJWA needed to identify where all the lead service lines are located within its distribution area. GIS was selected as a solution because it provides both spatial and tabular information to end users. The challenge became finding the best way to represent this information in a user-friendly and easy-to-use format.
The Lead Service Line Inventory Solution
After reviewing Esri’s Lead Service Line Inventory solution, GJWA determined it to be the best way to begin its inventory efforts. The solution provided the spatial and tabular information that both GJWA and USEPA required under the Lead and Copper Rule Revisions.

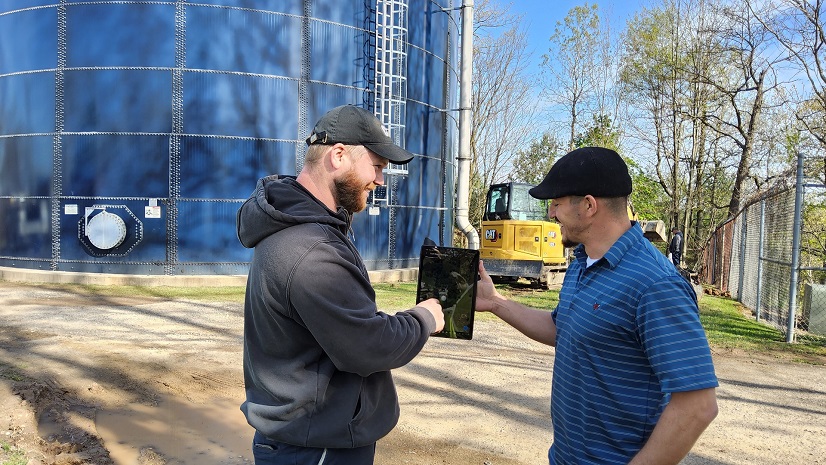
GJWA’s GIS was lacking information on the curb stop locations, which would require mobile staff to frequently switch apps between ArcGIS Explorer or ArcGIS Field Maps and the billing software, where scans of tap cards are stored. With the deployment of the lead service line inventory solution, GIS staff are able to provide scans of the tap cards directly in the GIS for each address that is entered. To date, GJWA has entered about 50 percent of its nearly 22,000 connections into the dataset. This solution has saved its locator time and effort in the field and improved communications with contractors digging near its service lines, as GJWA can easily identify pipe materials and size from the online maps. On average, the locator has saved two minutes per curb box by being able to look at the map and have the curb card information at his fingertips. The locator saves additional time when locating services on entire streets, as the service material and sizes can easily be displayed on the map or are just one click away, as opposed to switching between different apps frequently. When locating an average of 600 curb boxes per month, the time savings can exceed 20 hours per month. Because GJWA’s inventory is currently in the process of being completed and its locator is truthing some of the information, the time savings has not been completely realized yet and may even be greater.
Also, prior to the lead service line inventory layers being added to the map, outside contractors would mistake an old, retired lead service for the renewed and active service line, which could result in a broken service line. With this new layer, the GJWA locator can easily identify any neighborhood where lead service lines are prevalent and take extra measures to notify the contractor where two service lines may exist (one active and one retired/abandoned). This has been beneficial in preventing service line leaks, which could result in cost savings ranging from $500 to $5,000 depending on materials needed and nonrevenue water loss. An estimated $75,000 is being saved per year with just the implementation of the Lead Service Line Inventory solution from Esri.
Web-Enabled Workflows
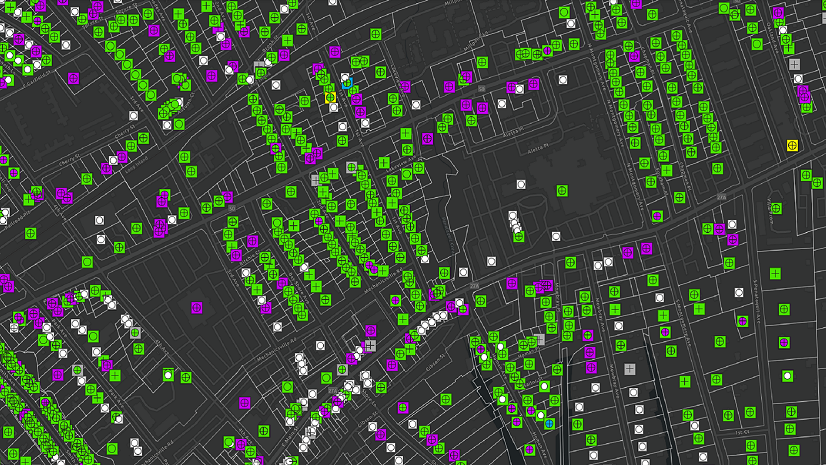
GJWA has put the Lead Service Line Inventory data layers onto its ArcGIS Online maps. These maps are reviewed by office and mobile staff and have been used for a multitude of water authority tasks, from improved asset locating, customer support, and project and budget planning to coordinating projects with other entities to reduce restoration costs and inconveniences to the public. For example, an outside organization may identify a project within the GJWA service area. The project limits will be overlaid on the GIS to see if there are any project overlaps or to identify any lead, galvanized, or unknown service lines within the project area. If there is work to be done, GJWA will coordinate with the outside organization so that both projects could occur either simultaneously or in series to limit inconveniences to the public and to share in the roadway, sidewalk, or lawn restoration expenses. This coordination has been beneficial for both organizations, especially with stretching tight budgets and increasing the amount of lead GJWA has been able to remove from its system.
The Lead Service Line Dashboard is another feature of the Lead Service Inventory solution to help staff stay apprised of which side (public or private) most of GJWA’s lead service lines are on and the number of unknown and unverified service lines. This information needs to be verified and known to improve the inventory and to ensure that GJWA will be a lead-free potable water utility in the future. The dashboard will look different in the updated solution release, but GJWA has been using the original dashboard and may continue to do so after updating to the newer solution release.

Mobile staff report that they find the maps more useful, having all the information within one cloud network rather than having to hop from one cloud to another to get all the information needed for a task. GJWA is making progress with its GIS; however, there is plenty of room for improvement and more data to add. Currently, much of the GIS database is slightly more than points and lines, with very limited data to go with them. GJWA is in the process of updating the attribute tables and attaching as many paper (hard-copy) drawings or sketches into the GIS as possible to assist with locating the assets in the field, which will make the marking of assets or the excavation as efficient as possible while avoiding damages to underground utilities.
Next Steps
The next step for GJWA in regard to the Lead Service Line Inventory solution is to update to the newest release, which is planned for later this year. The latest release allows for an export to a CSV file that matches the template provided by USEPA and is very similar to the format used by the Pennsylvania Department of Environmental Protection (PA DEP). The new release also has updated dashboards for tracking service line materials and replacements. Because GJWA serves a population of over 50,000, an online map is required. As part of that requirement, GJWA is planning on—at a minimum—utilizing the public-facing map already included with this solution, and it may use the entire online hub so that customers can view and submit ArcGIS Survey123 forms of their service line information.
GJWA will revise and update its current Lead Service Line Replacement Plan to incorporate the findings and trends identified by using the GIS solution. One way the GIS will be useful in updating the replacement plan is by selecting areas where lead service line concentrations are high and ease of replacement is greatest. As identified earlier, the GIS has already been beneficial for coordinating projects with other entities to continue to share some of the costs of restoration.
Depending on how the Survey123 communications go between the customers and GJWA for the inventory responses, GJWA may incorporate a second Survey123 form for customers to report outages, complaints, or issues within the water or sewer systems—especially given the ease of recording conversations, location, and related geospatial information. GJWA is also evaluating the internal use of Survey123 for its complaints department so that it can start tracking this information spatially.
The Esri GIS solution has allowed the GIS staff at GJWA to stay ahead of the upcoming requirements to the Lead Service Inventory. The tool has proved itself useful and efficient as we navigate this process.
Stay Connected with Esri’s Water Team
ArcGIS is an extensive information system that enables modernization of workflows with easy-to-use applications for the field and office. Strengthen your organization with smart water solutions that will increase efficiency and provide insight for decision-makers. Visit the Esri Water Utilities web site for more information.
Join the Water Utilities Community
Follow #EsriWater on social media: Twitter | LinkedIn
Subscribe to the Water Industry newsletter “Esri News for Water Utilities and Water Resources“