If you’ve followed this blog series for the last several months, you know a recurring theme that we emphasize is the importance of a data-driven approach to planning. It’s a key tenet in being able to justify specific designs and developments in a community, because it moves away from a strictly anecdotal approach (e.g. I think this type of design would look good in this neighborhood) to one that focuses on attainable metrics (e.g. This design will bring in x number of residents, y number of jobs, etc.). As a planner, you have an advantage over others in your organization in that you understand the types of designs and developments that are likely to look and work best in a neighborhood. This data-driven approach helps you further quantify and qualify your recommendations.
While this is true in the planning of specific developments, it’s also equally true in validating policy about where and why these developments are needed. Often, these policies are created at a higher level than the person designing the development (e.g. city manager, planning commissioner, elected official, etc.).
Planners and GIS play an integral role in decision making regarding housing policy, because location is at the epicenter of this topic. Planners and policy makers must be able to define the needs, benefits, and challenges in assigning areas for affordable housing and economic, mitigating homelessness, and understanding the capacity for growth in neighborhoods.
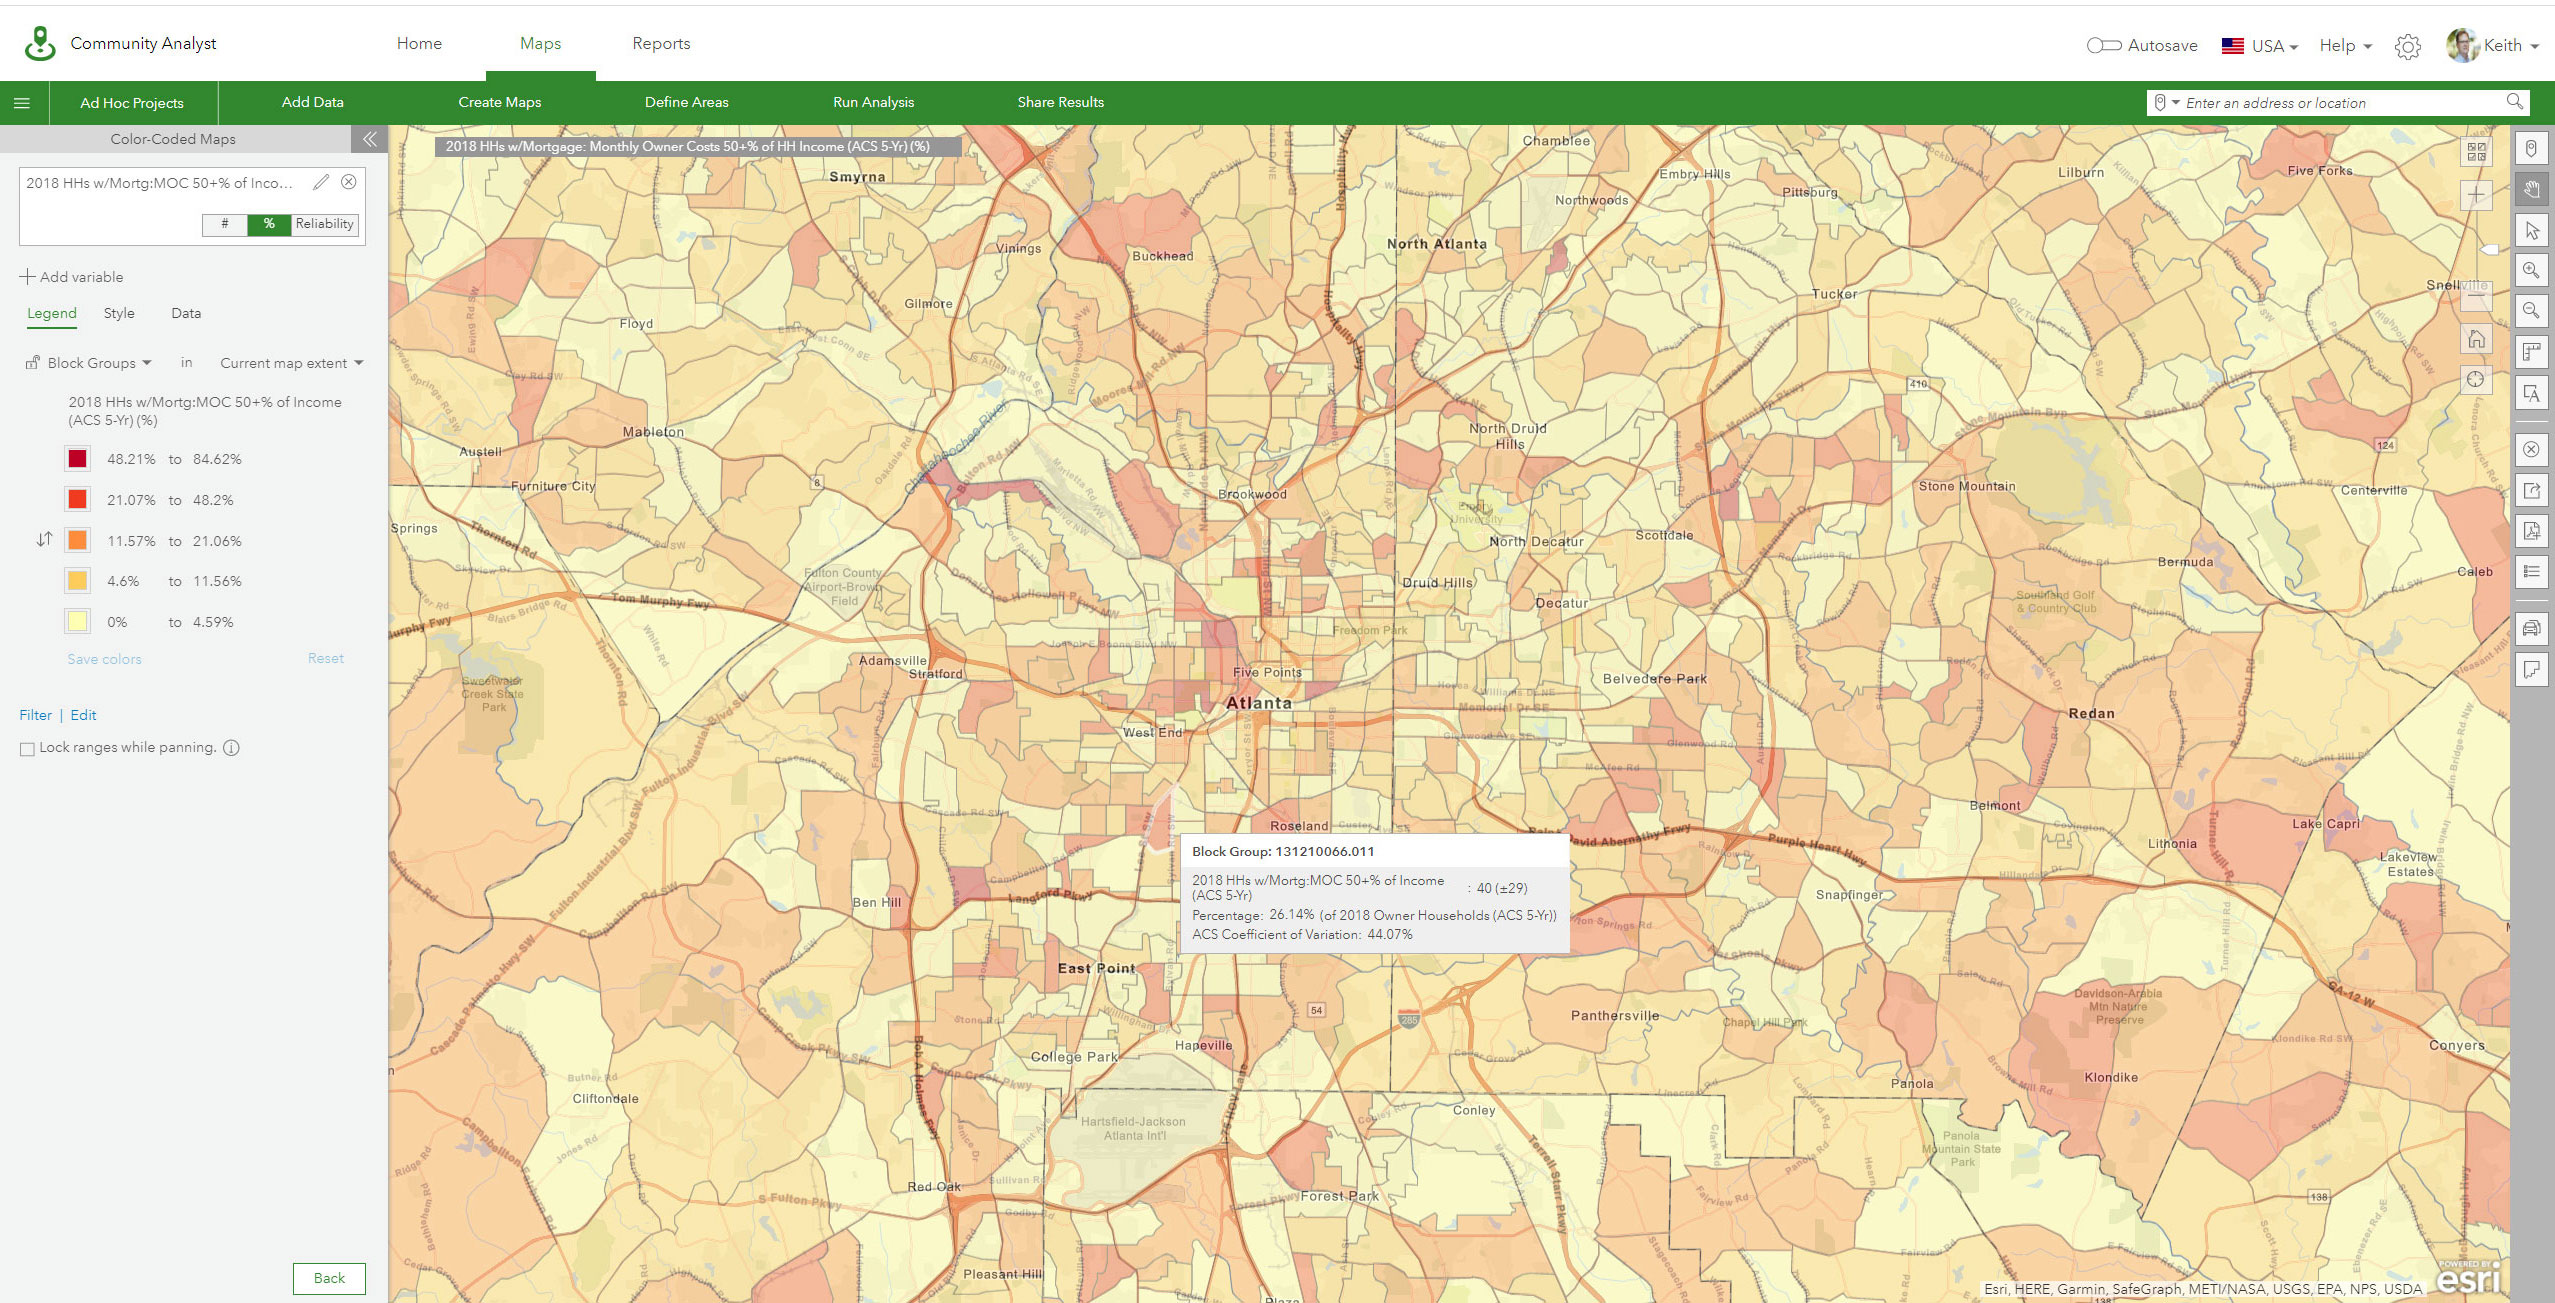
This starts with identifying and analyzing demographic and socio-economic variables for neighborhoods to successfully assess their needs. ArcGIS Community Analyst provides the platform to be able to view over 1700 variables to understand the make up and needs of neighborhoods down to the Census block group level. This is a map of the metro Atlanta area showing households with a mortgage that are paying at least 50% of their income towards housing. The darker colors represent the highest concentrations of these households.
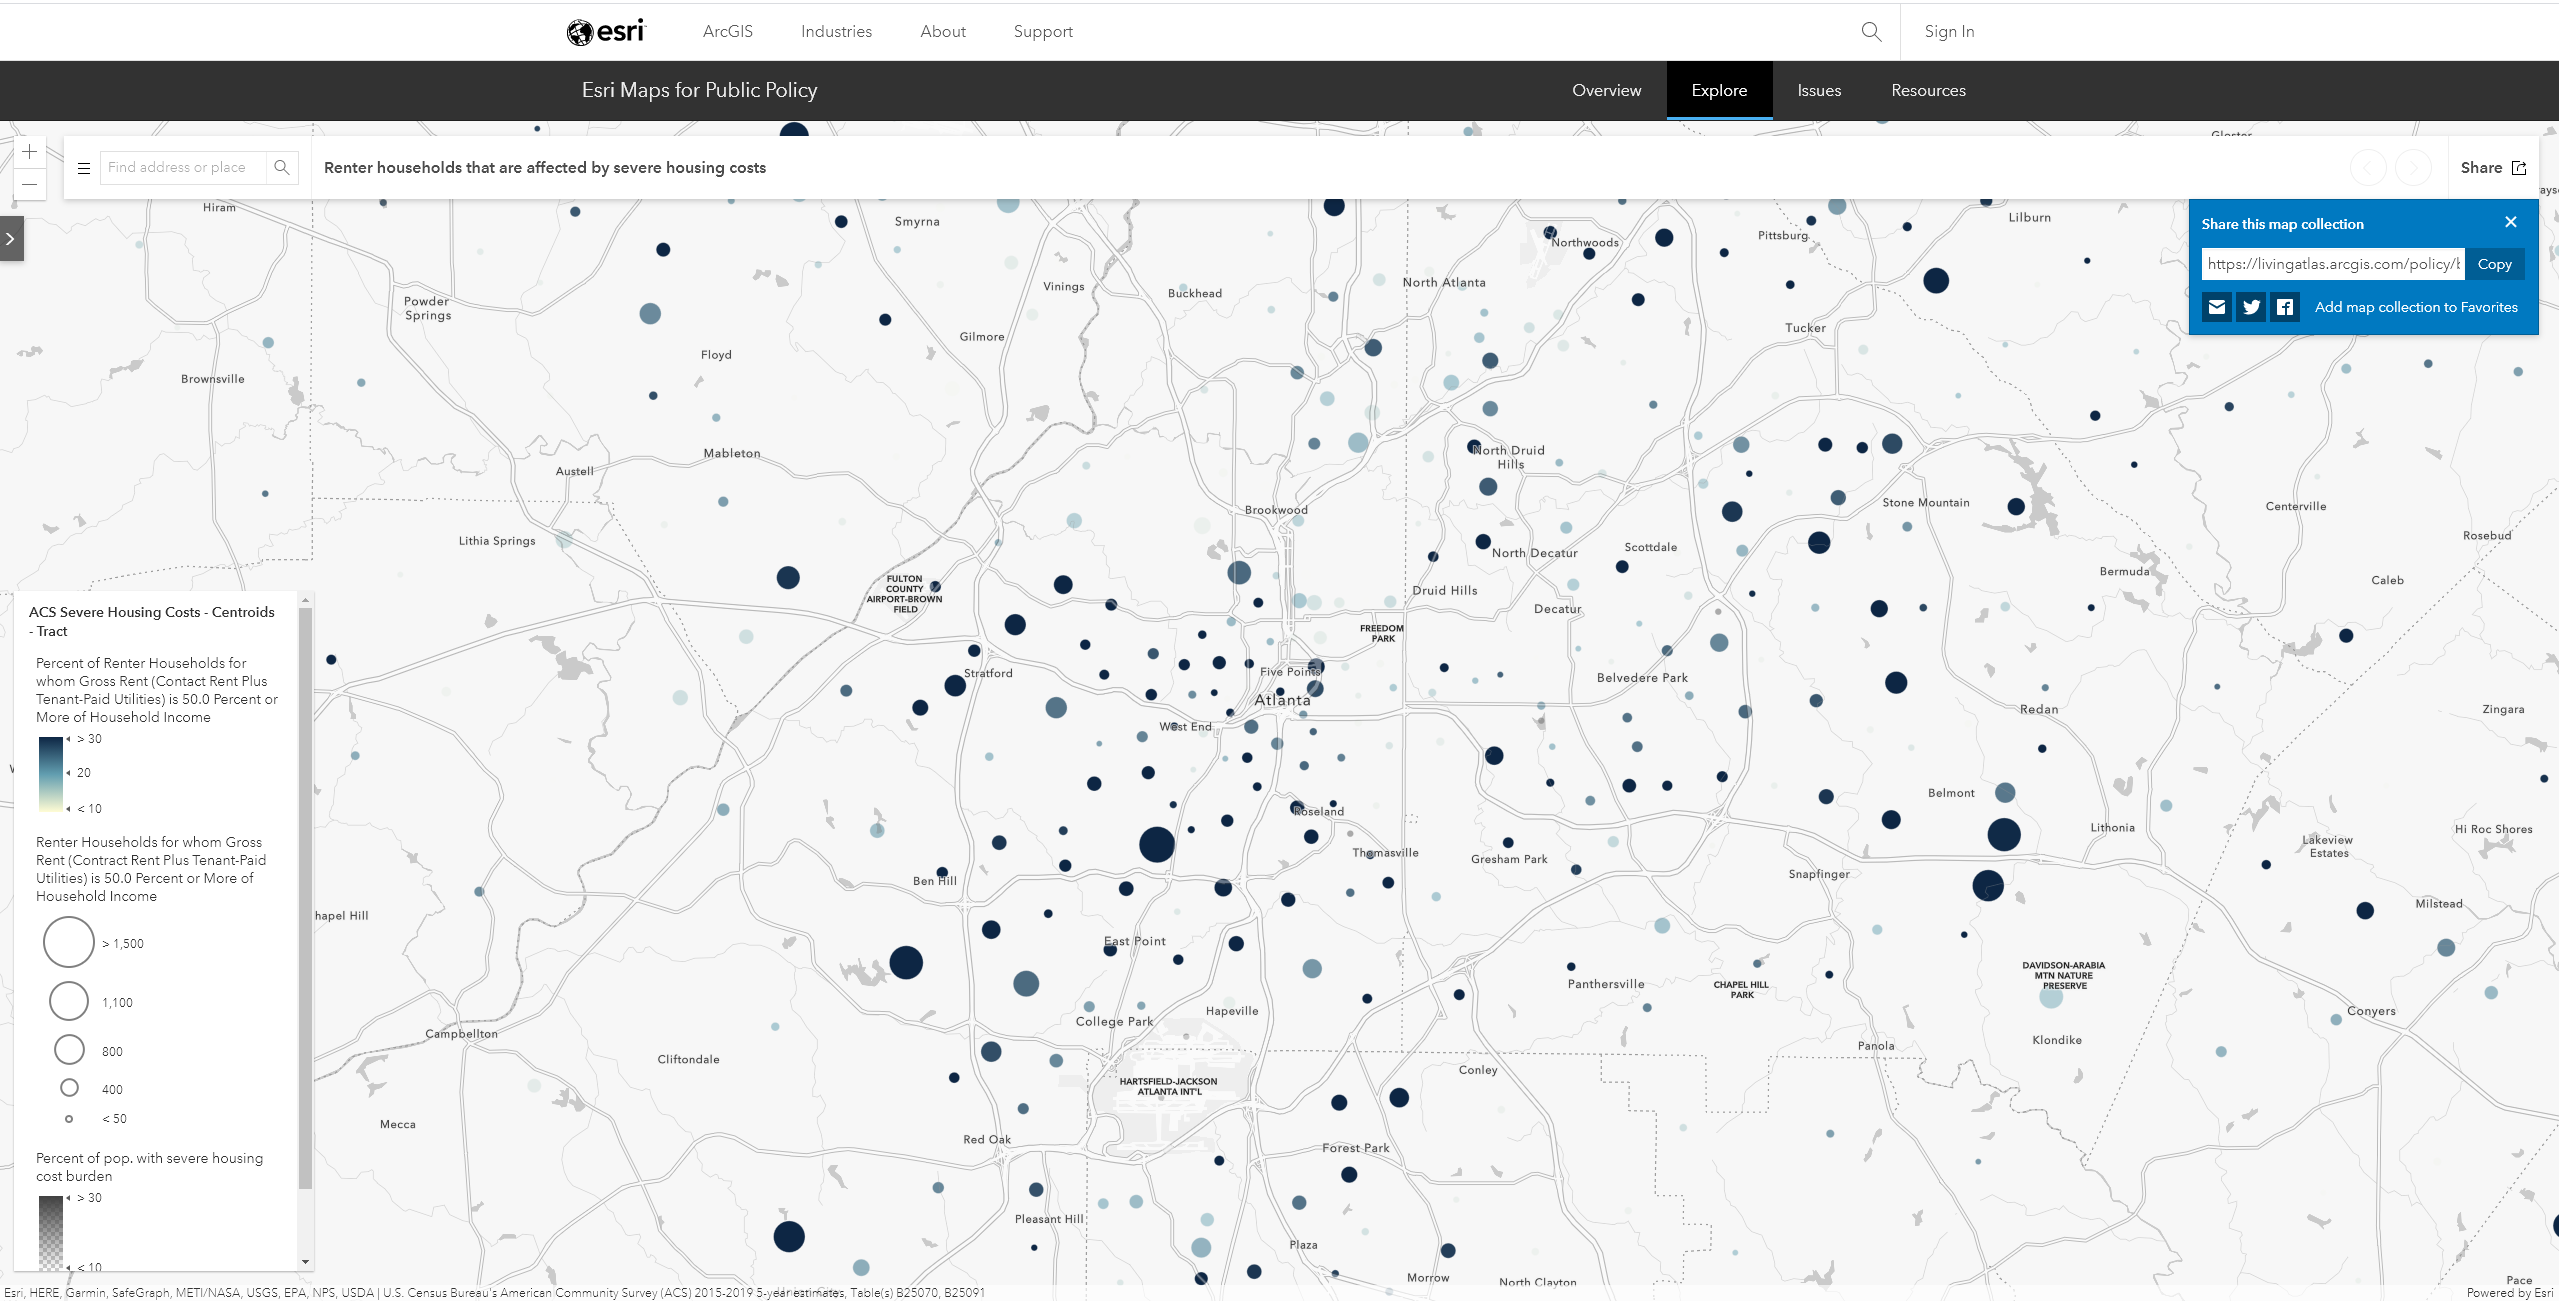
From a policy standpoint, this data helps us understand where affordable housing, combined with a sustainable economic mobility policy, is most needed. But, it’s not just homeowners that are struggling. Renters also make up a large percentage of the need for affordable housing, especially with younger generations. The Esri Maps for Public Policy app, a part of the Living Atlas, provides free access to data that can be used to help validate policy decisions. In this map, we can see where renters in the metro Atlanta area are burdened by severe housing costs.
I can overlay my Renters map and my Homeowners map to understand where the most crucial needs are for affordable housing. However, there are often more factors that would drive our policy making. This is where the Policy Validation Application (PVA), an add-on to ArcGIS Urban would come into play. This allows me to take multiple variables at once, assign weights to each metric, and identify the best location for affordable housing down to the parcel level.
Specifically, I can look at the parameters that would drive the feasibility of affordable housing in a neighborhood, such as proximity to available transit, proximity to grocery stores, schools, and health services. Affordable housing as a policy doesn’t work unless it’s coupled to economic mobility, so I would also want to look at employment opportunities (both present and future plans) in the area.
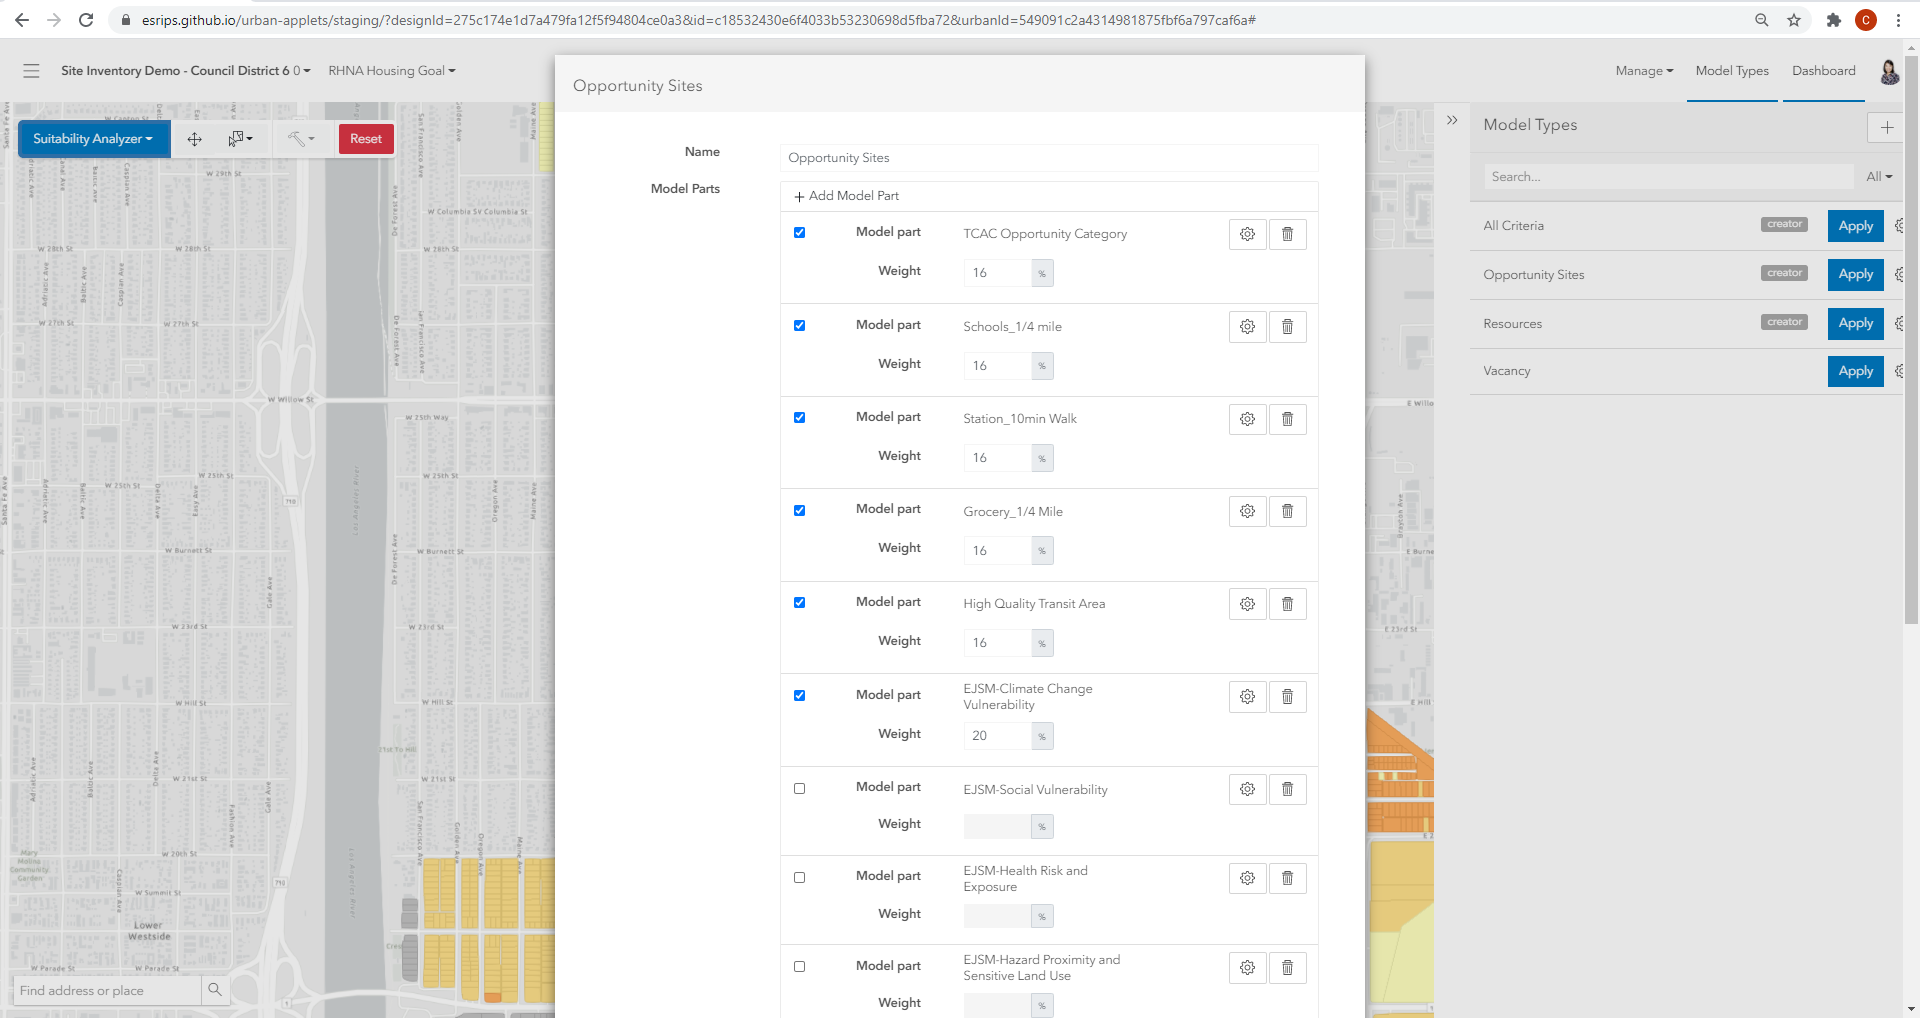
Assigning values to each of these metrics allows me to assess site suitability based on what’s important to me as a policy maker.
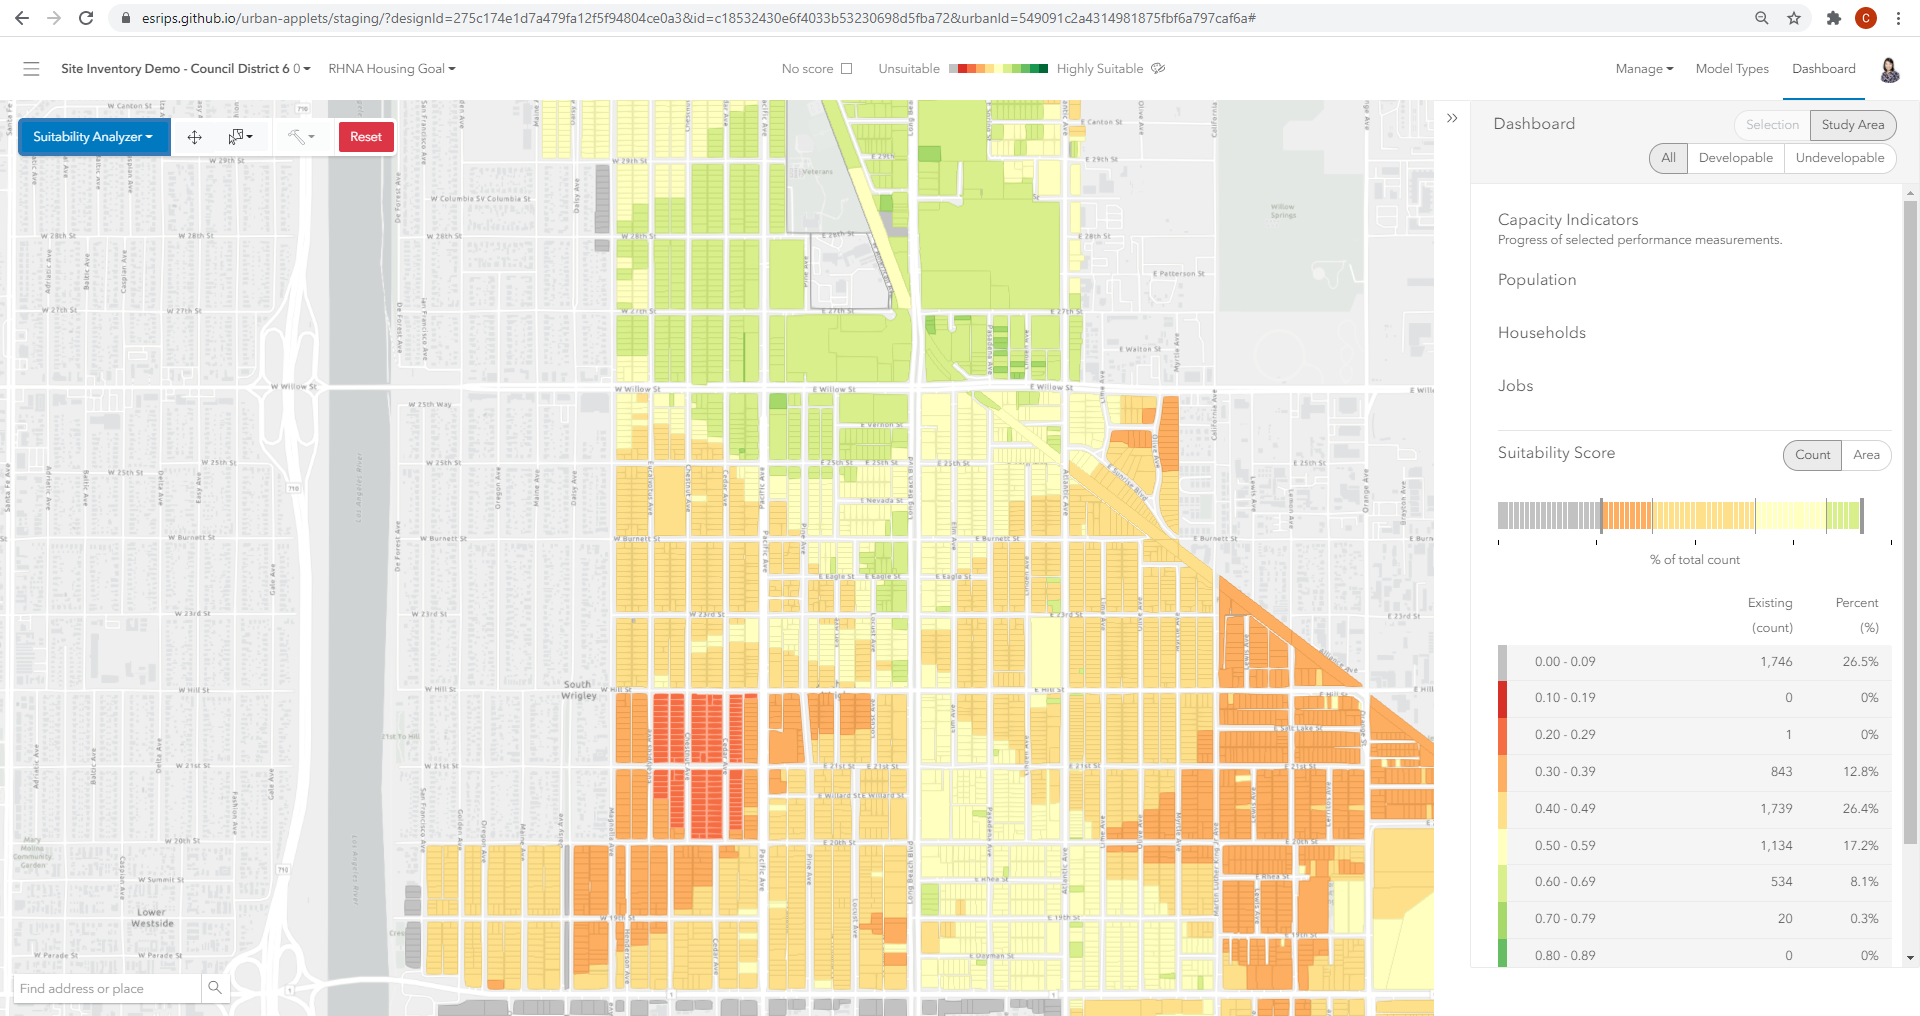
Now, administrators, elected officials, stakeholders, and of course, planners can have a data-driven discussion about where affordable housing needs to occur. We’ve identified the need and the best locations and methods to address that need. There’s no ambiguity about the data. It’s clear cut, and everyone can be on the same page.
Taking a data-driven approach to site suitability, planners can develop multiple housing scenarios in neighborhoods and measure their potential effectiveness. Policy makers can then evaluate and visualize these scenarios, collaborate with community leaders, and engage the public to meet their expectations for transparency and accountability.