This blog is a continuation of my previous blog where I demonstrated Map Viewer Charts for data exploration. The web app that we will be focusing on in this blog is Chart Viewer in ArcGIS Instant Apps. Why? Because using its template, we can display multiple charts to complement a map.
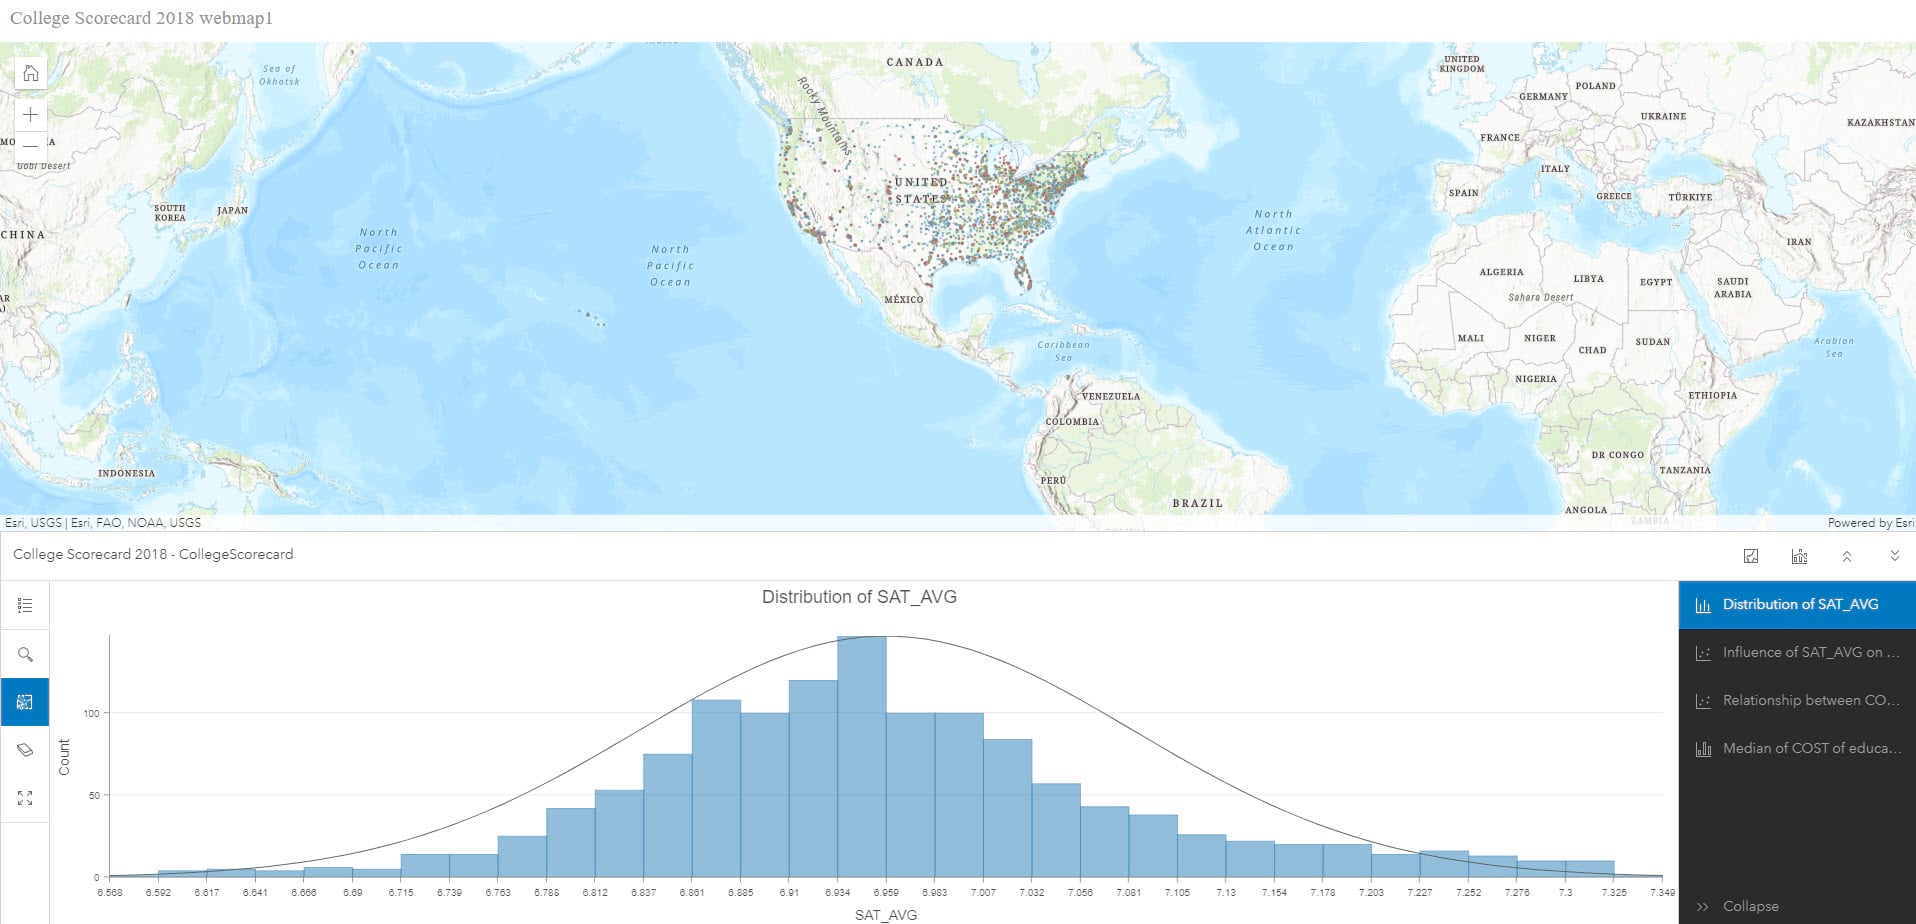
In this tutorial, we will use Chart Viewer from Instant Apps to publish this web app using a web map containing charts created in Map Viewer. Chart Viewer supports all chart types offered in Map Viewer (bar, line, pie, histogram and scatter plot), hence our web map can contain any or all chart types.
Let’s get started right-away with a web map-
Step 1 – Import your web map to Instant apps
We will need to sign-in into our ArcGIS Online account to access Create App options. We will be using this web map that was created in the previous blog using Map Viewer. You can use your own web map to follow along, just ensure that the web map is saved in Map Viewer and has at least one chart in it. Once you have a web map open in Map Viewer, click on Create app and select Instant Apps from the dark pane.
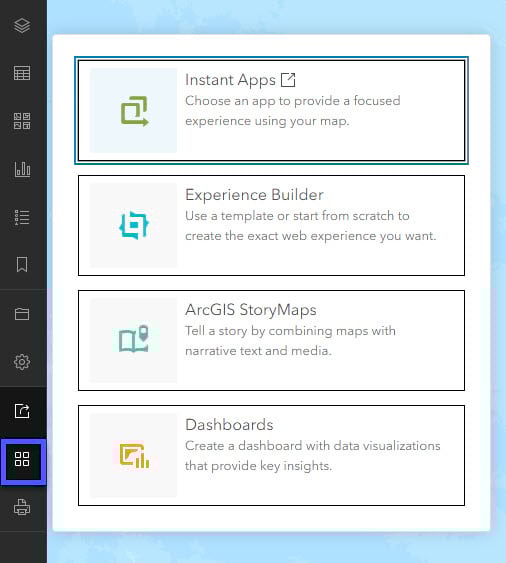
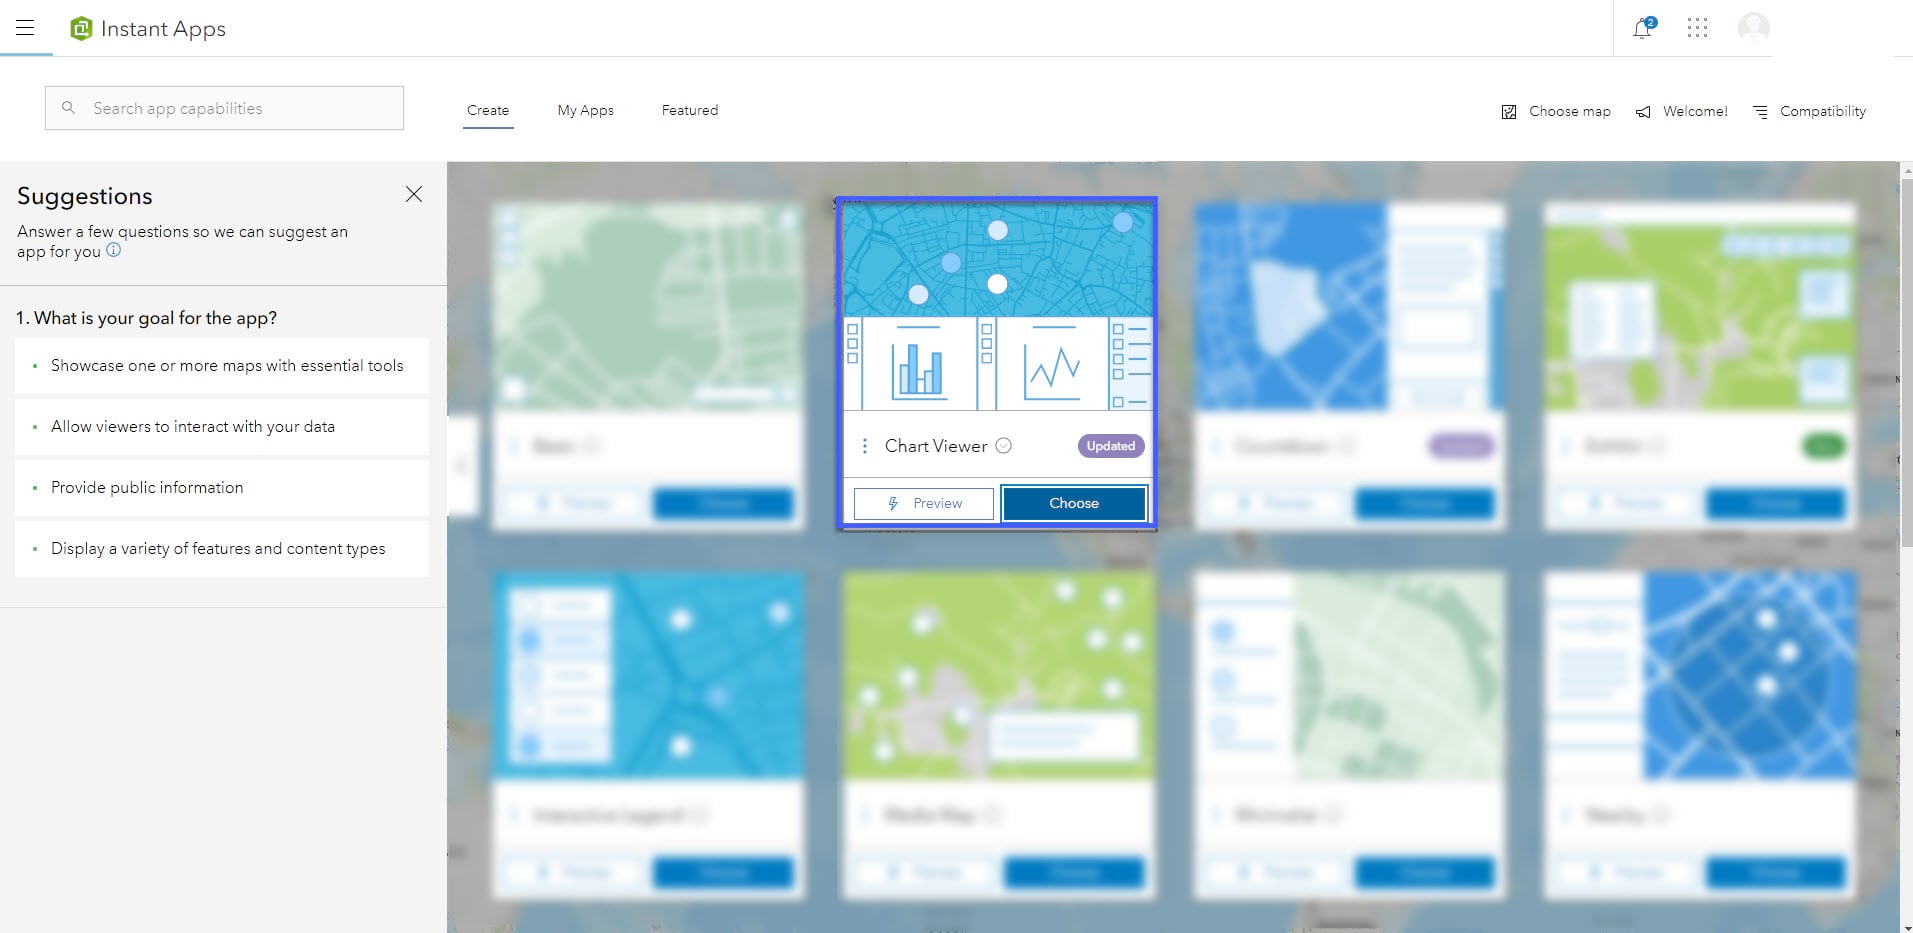
Step 2 – Choose a template
ArcGIS Instant Apps offers a variety of web app templates based on your requirements like Exhibit, Nearby, Chart Viewer etc. In this tutorial we will use the Chart Viewer template to publish our web map and charts together in a web app. Next, select Chart Viewer from the layout options. Give your app a title and hit Create app.
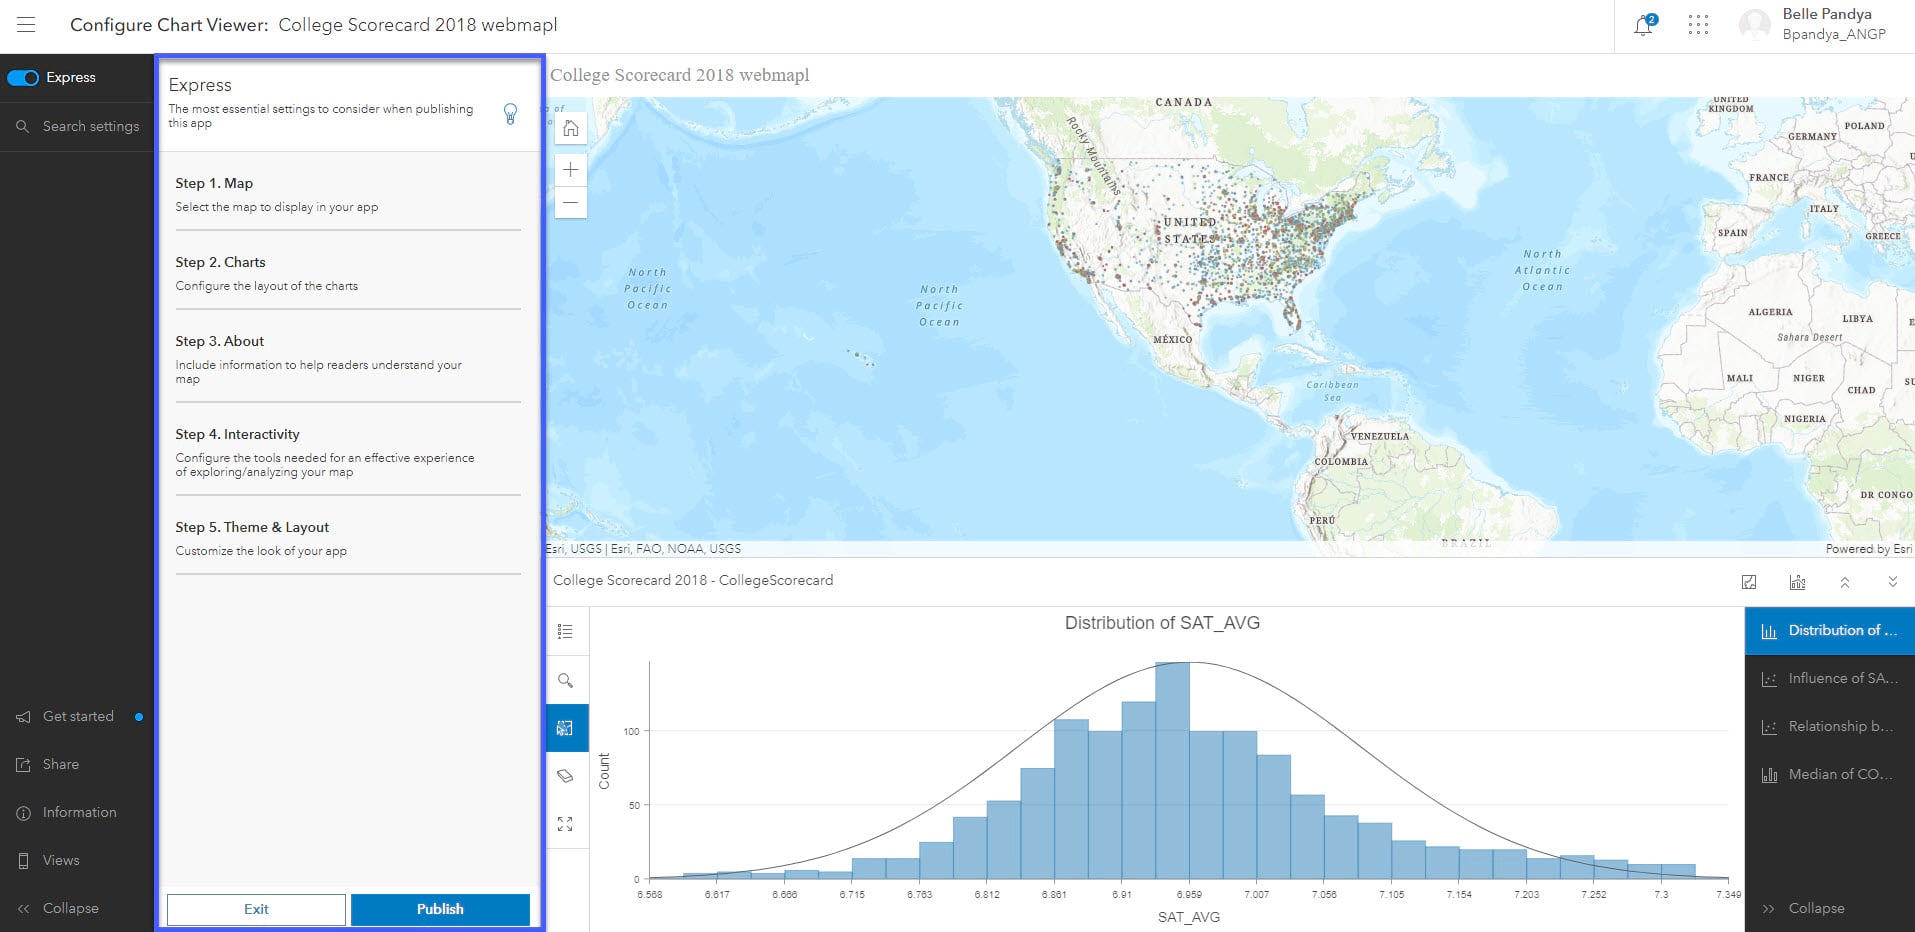
Step 3 – Configure Chart Viewer
Configure your Chart Viewer app template using the five steps explained in this blog. I generally proceed with using the default settings unless I am working on more than one layer or require customization.
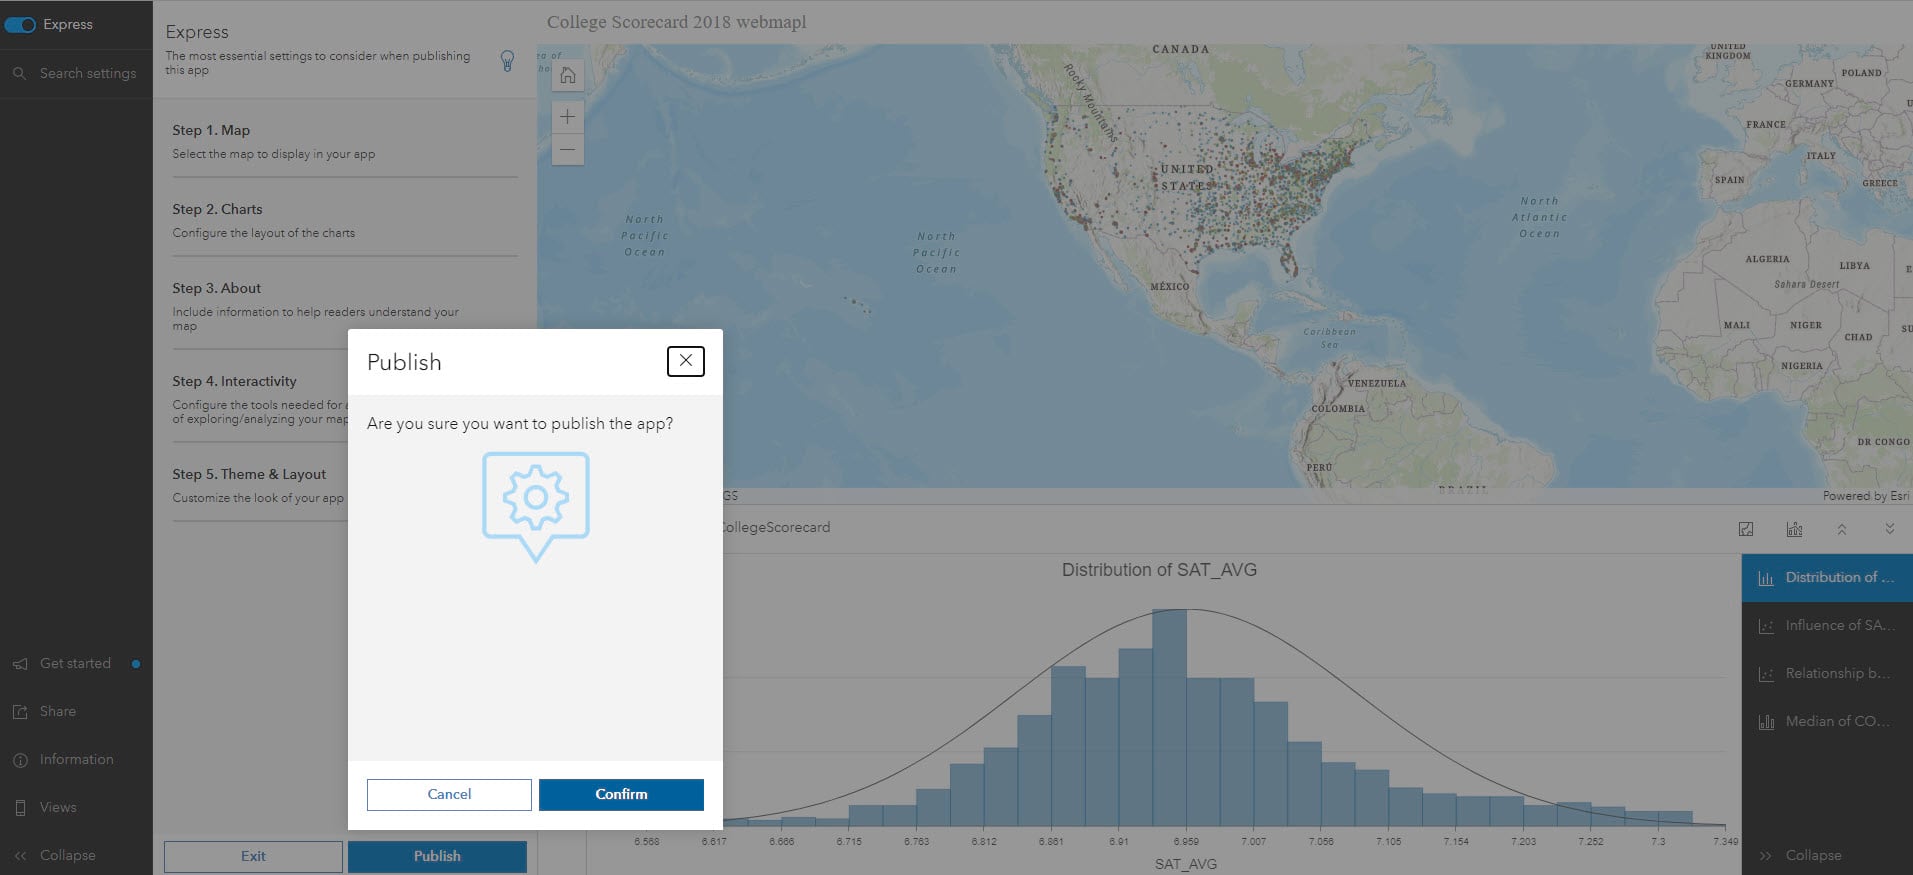
Step 4 – Publish your web app
After configuration, select Publish and then Confirm.
Step 5 – Launch the web app
Once your web app is published, a ‘Share’ pop-up will appear. This pop-up will provide several options on how to share the web app. To simply launch the web app, select Launch from the pop-up. The app will be launched in a new window. Voila! Your web app is ready. It should look like this.
Explore your visualizations
So far, we have learned how to set up a template using Chart Viewer but your journey to share your insightful viz doesn’t stop here.
- Make a selection on any displayed chart and the corresponding features will be highlighted across the remaining chart(s) and the map. Clicking on Clear selection control from chart action bar will remove the selection.
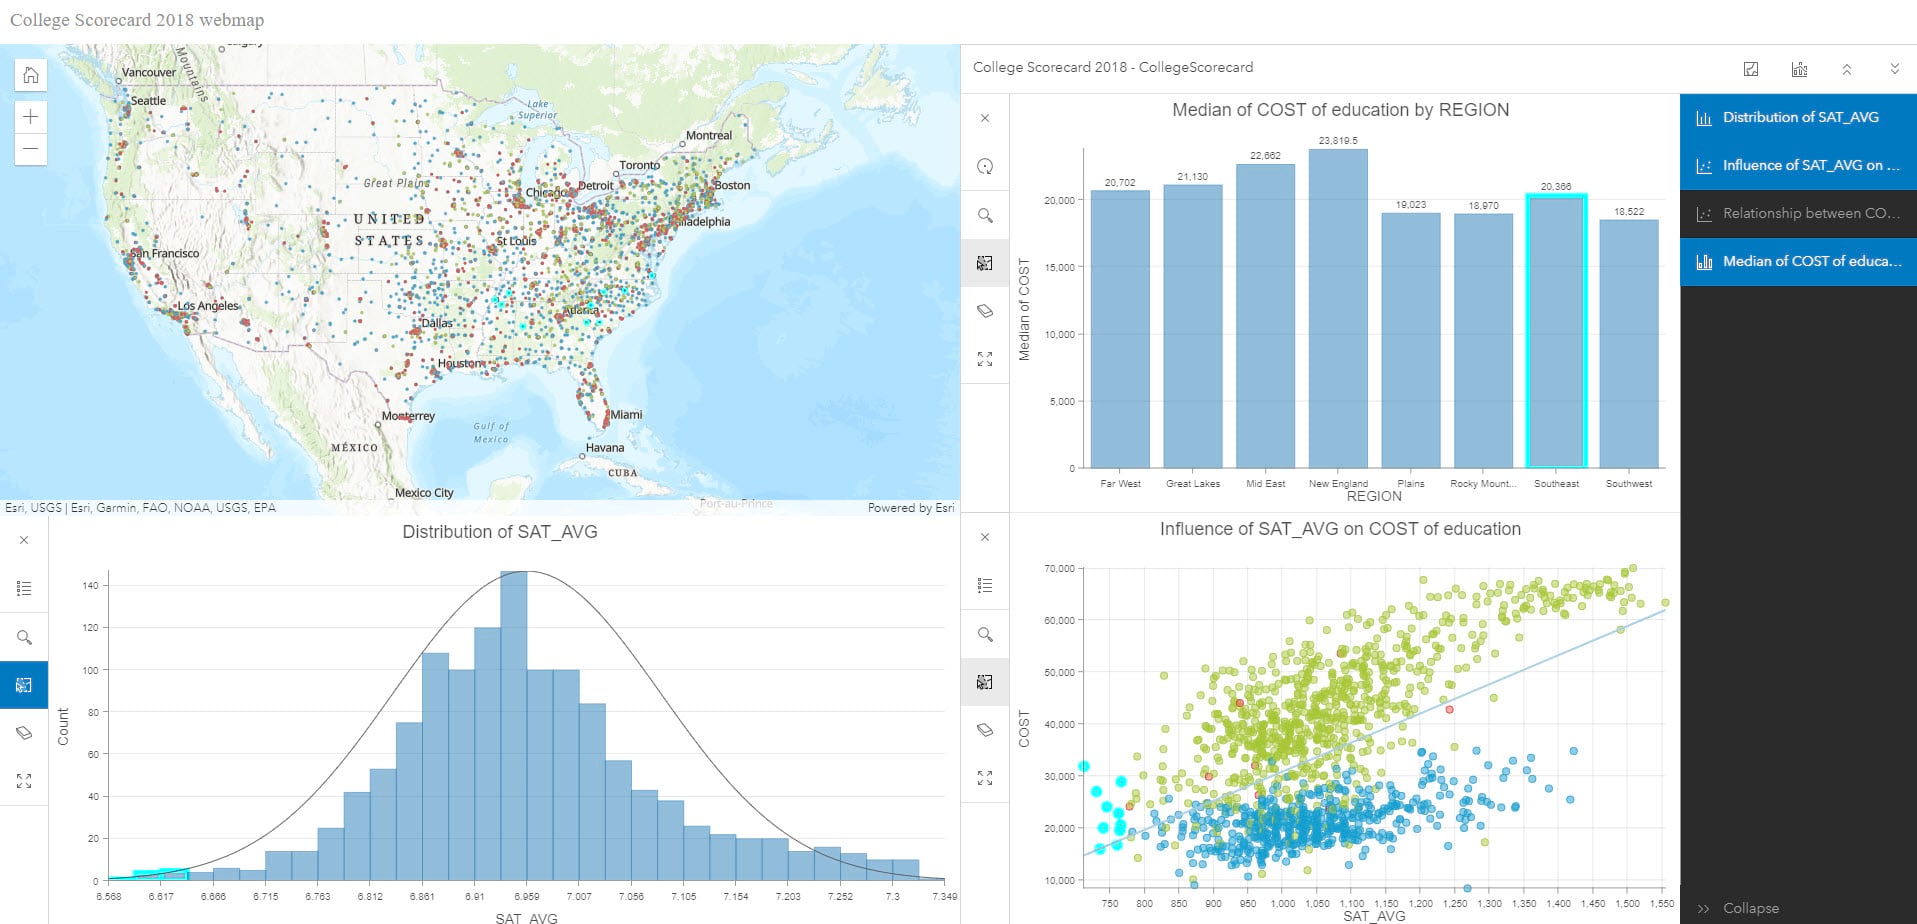
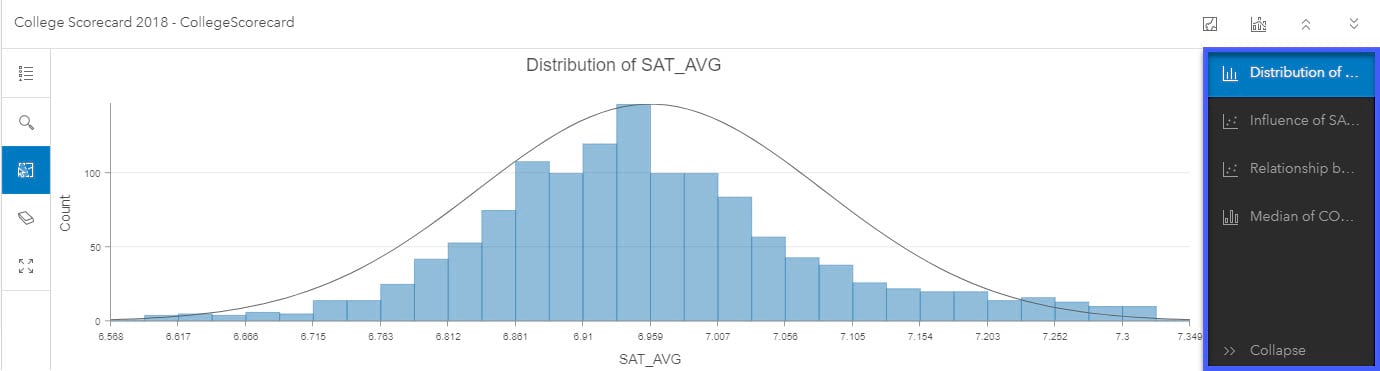
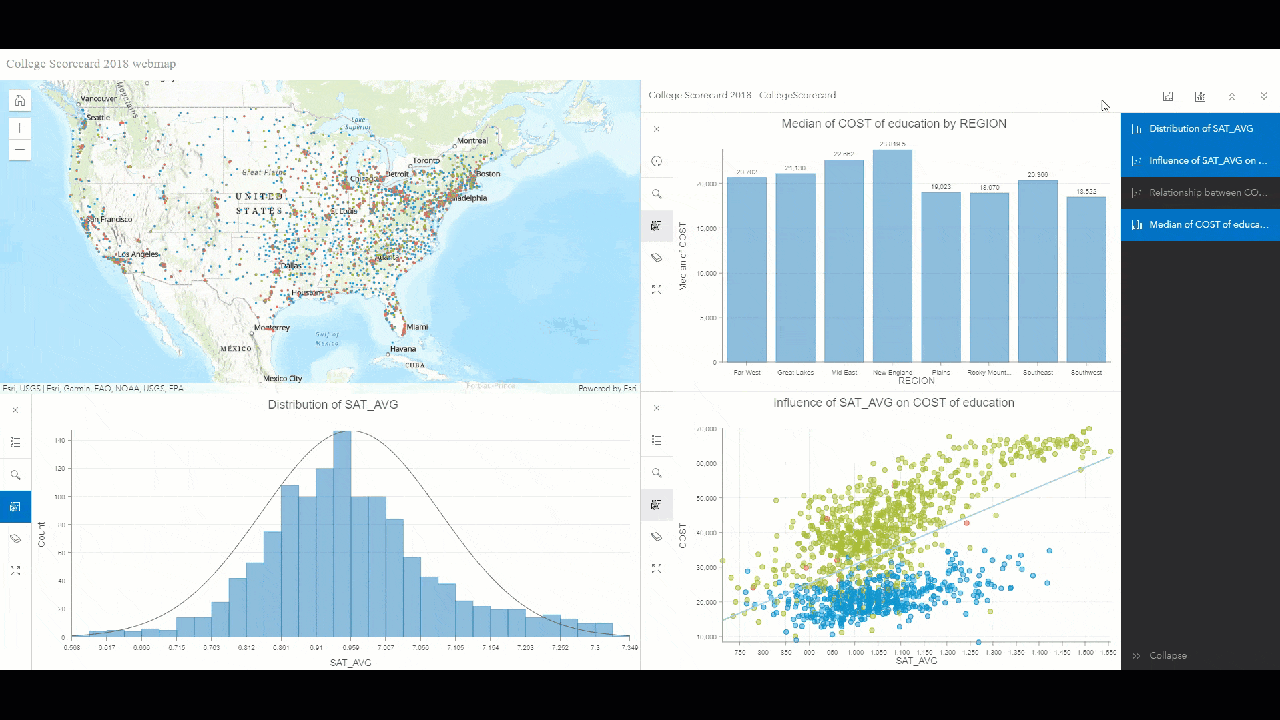
- By default, the template will display one chart along with the map. By clicking on chart names from the list in the bottom right corner, up to three charts can be displayed along with the map. To hide a chart from the view, click on its name again.
- To display only the map or only the chart(s), select View map only or View charts only controls respectively. To return to the view with the map and chart(s) both, click on the selected control again.
To conclude, we learned how to use the Chart Viewer Instant Apps template to quickly create a web app for visually exploring our data through charts and a map. If you have any questions about using Chart Viewer template in Instant Apps, please leave them in the comments down below.


Experience Builder doesn’t provide everything that WAB has. It’s a shame seeing it being retired instead of improved upon!!
Well it is just a matter of time before we have to move on as WAB is built on an old JS version. I know that EXB is getting more and more features all the time, but people need more time to adopt those tools in their day to day workflows before they remove options for using existing tools. Just because EXB has a feature, doesn’t mean its bugs have been flushed out, which needs to happen before people move off of WAB. Hopefully ESRI pushes this a bit more.
Yes – while I continue to be excited about the opportunities and capabilities the ExB provides, we still need – at a minimum – an interaction option between/with several widgets and the map popup. We can’t just rely on the Feature Info and Text (with dynamic link) widgets to return layer information. For example, the Search widget is great for feature layer searches to return info – but I still have to configure a separate Feature Info widgets to return results for each layer I want to use as a layer search source. This is a fundamental use of Search… Read more »
BOOOOOOOOO!!! Upgrade WAB!!! ExB has some great features, BUT… WAB is easier and quicker to get an app going than ExB.
Alas, for sites like ours, with NO GPUs moving to Experience Builder is simply not an option, and it will be several years until our estate has migrated from VMs back to physical PCs
With ArcGIS Solutions, the WAB in those content items will need updated (example: Sewer Data Management Solution and the Sewer Editor content item is from Web App Builder). Is there any info on how those can best be updated to Experience Builder?