Below you’ll find answers to some of our most frequently asked questions about Charts in Map Viewer. If you still have questions, please do not hesitate to contact us by commenting on this post or via Esri community page.
Do I need credits to create charts in Map Viewer?
No, creating charts in Map Viewer doesn’t consume credits but you do need an ArcGIS account to save and share charts.
My data is usually in CSV format, without geolocations. Can I still create charts in Map Viewer?
Yes, charting is supported for tables, including CSV files. If your file does not contain location data it will be added as a table instead of a feature layer and you can create a chart from the Tables pane.
Can I share a Chart Viewer Instant App with viewers who don’t have an ArcGIS Online account?
Yes, apps can be shared with the public and viewers don’t need any type of license as long as the data, map and app are shared publicly.
Can scatterplot axes be displayed on a logarithmic scale?
Yes! Logging axes is possible for scatterplots and line charts. Once you create your chart, simply navigate to the Axes tab. Here, you will see toggle controls for enabling and disabling logarithmic scale for both x-axis and y-axis. Logarithmic scales can only be applied when all values are greater than zero.
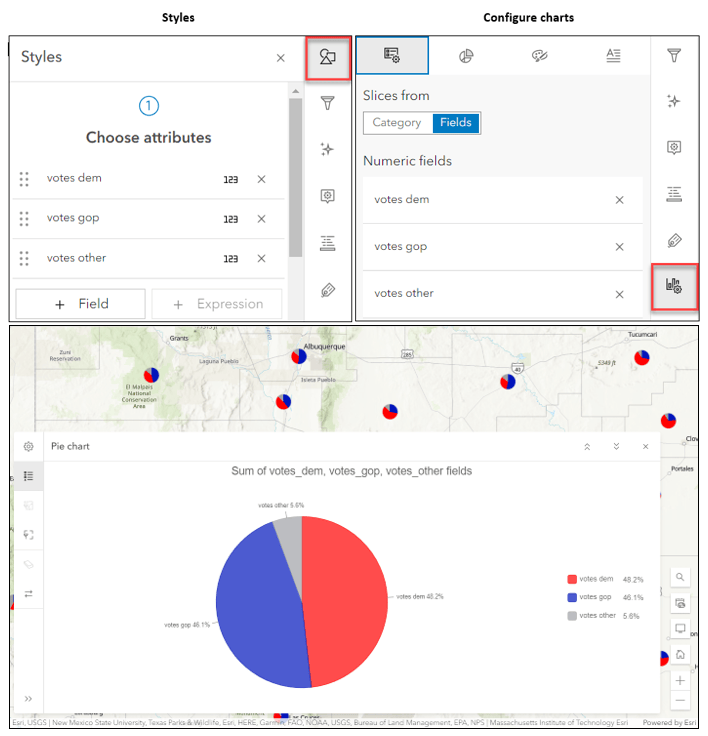
How can I get my pie chart to match pie chart map symbology?
You absolutely can make it work! If you create a pie chart using the same numeric fields you used in symbology (Styles), the slice colors will match.
Can I create a donut chart in Map Viewer?
Yes, you can! Use Configure charts from the Settings (light) toolbar to create a pie chart first. Navigate to the Slices tab and use the Shape slider to increase the size of the hole to create a donut chart.
How do I display a subset of data that falls under a specific range?
There are two ways to do this –
- Use Filters from the Settings (light) toolbar and add an expression to show the data you want and temporarily hide the rest. To add a filter in Map Viewer, follow the instructions here. Remove the filter and save the settings to re-display all the data.
- Select and highlight data points on the chart and use Filter by selection from the toolbar.
How do I stay updated with your latest work?
You can either check out ArcGIS Online announcements every release or Charts resource page to stay current with charts related updates.
New to Map Viewer Charts?
Here are some articles to help you get started –


Article Discussion: