The December 2021 Map Viewer update is here! The update includes many enhancements, such as HTML source editing for pop-ups, feature-specific effects, an improved sketch experience, and many more. Read below to learn more about the recent features and enhancements now available in Map Viewer.
Feature-specific effects
With the latest update, you can now use effects to emphasize specific features in a layer. Effects such as Bloom and Grayscale, Drop Shadow and Blur, and more are used to apply effects to highlight some features in a layer based on conditions that you define.

See Feature-Specific Effects: The next enhancement for Map Effects for more details and inspiration for your maps.
Pop-ups
The December release also includes several enhancements for pop-ups.
Editing source HTML
Whether starting from an existing map previously authored in Map Viewer Classic, or starting fresh in Map Viewer, you can add or modify the source HTML for your pop-ups. Improved integration with supported HTML helps provide a consistent WYSWYG.
To access the source HTML, use the source button on the pop-up text editor.

Arcade-driven clustering pop-ups
Previously, only cluster attributes like average value, count, and predominant value were available with clustering pop-ups. With the latest update, you can use a few lines of Arcade to display additional information about the features in the cluster, such as all of the features contained in the cluster, or minimum / maximum values.
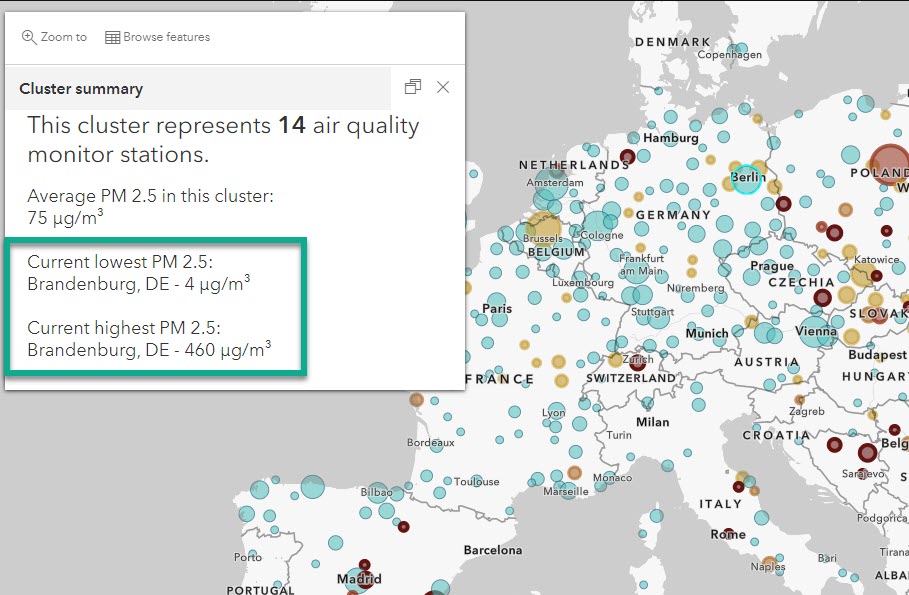
Stay tuned for an upcoming blog for more details on using Arcade to drive your clustering pop-ups.
Arcade-driven content elements
The December Map Viewer update provides even more control and flexibility to build the pop-up you envision. In addition to using Arcade expressions to return attributes, you can now use Arcade to define an entire block of content whether that is rich text, charts, formatted list of fields or any combination of these pop-up content elements.

For more details, check out Introducing Arcade pop-up content elements.
Smart Mapping
The December 2021 Map Viewer update includes several enhancements in Smart Mapping.
Performance updates
Smart mapping optimizations in the JavaScript API for ArcGIS mean better performance in Map Viewer. Statistics, class breaks, and other internal computations are handled in a more efficient manner, providing improved responsiveness when styling your layer and adjusting class breaks or working with the Smart Mapping histogram.

For a deeper dive into the performance improvements, check out A better experience for styling layers using Arcade in ArcGIS Online.
More color ramps!
167 colorblind-friendly color ramps have been added to Map Viewer’s gallery, bringing the total to over 500. The new ramps include many that are designed for highlighting middle values in above and below visualization styles. Previously, color ramps for above and below styles use a transparent or neutral color where middle values were de-emphasized. However, sometimes the data values in the middle are what should be emphasized. With both approaches available in Map Viewer now, you can use the approach that works best for visualizing your data.

Check out New Map Viewer color ramps for more details.
Sketch enhancements
Sketch enhancements include easier access with a Sketch button on the (light) toolbar, as well as improved snapping controls improved and updated default symbology for lines and polygons.
For more details, see An enhanced sketch experience in Map Viewer.

Labels
Labels this release received several enhancements:
If you’ve used the layer effect drop shadow you have seen the XY slider already. We have added the XY Slider to help with label placement. As you move the point around in the XY slider you will see the label placement update in the map.

Labels on lines have been updated with the ability to control how a label repeats along features. You can now disable label repetition completely, or use a distance interval. Line labels also support label overrun, which allows labels that are larger than the feature being labeled to be displayed on the map.
A new FGDC GeoAge font has been added to label styles, a standard font for geologic map symbolization.
Tables
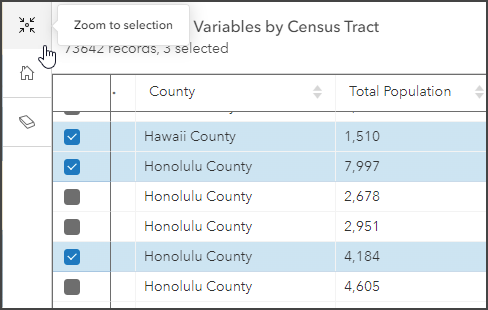
For feature layer tables, you can now select rows in the table and zoom to the location of the extent of all the selected features on the map.
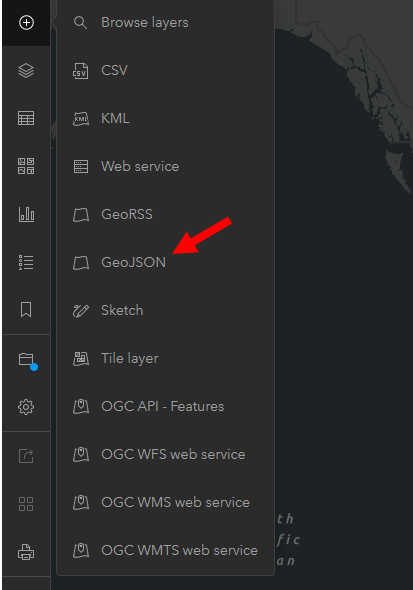
GeoJSON
You can now add GeoJSON feeds from a url in Map Viewer. Have a link for GeoJSON from a data hub? Or an earthquake feed? With Map Viewer, you can use smart mapping to style these layers, as well as configure effects, blend modes, filtering and more.
Imagery Layer enhancements
The latest update includes a couple enhancements for Imagery Layers as well. Time can be displayed (and configured!) for time-enabled Tiled Imagery layers. Additionally, you can now browse for Raster Function Templates to apply to your Imagery Layer.

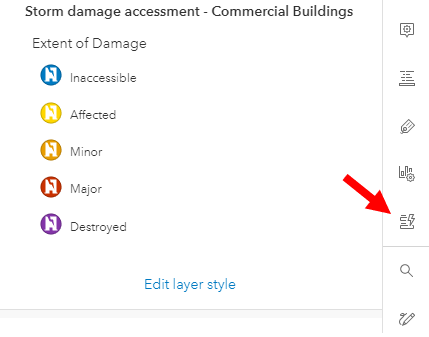
Managing layer properties
The December Map Viewer release includes improved authoring tools for managing layer properties. All layers include properties that can be configured in Map Viewer. For a feature layer, these properties include the layer’s style, pop-ups, filter, and more. Often, these properties are already configured and stored with the layer. When you open them in Map Viewer, you immediately see those configurations made by the layer owner. From there, you can further modify the layer as you see fit. When you save the web map, the configured properties for the layer are stored with the web map rather than the layer. Anyone viewing your web map will now see the changes you made to the layer’s properties. Any properties that haven’t been changed in the web map would continue being referenced from the source layer.
The latest update provides helpful indicators that tell which properties are stored in the web map (and are not referenced from the source), and which are stored with the source layer meaning any updates to layer properties will be automatically displayed in the web map. Currently, only feature layers display layer property status. Future updates will include support for more layer types.
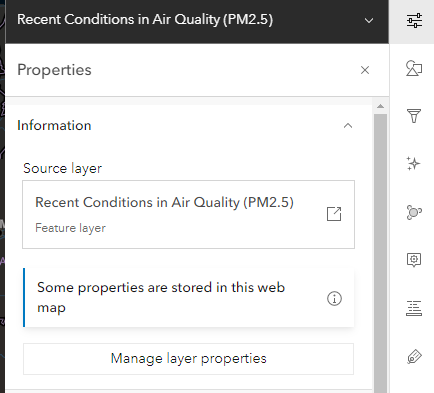
In addition to reporting the status for each layer property, you have the option to Reset to source layer properties, which will discard all properties that are stored in the web map and revert the layer to the properties that are stored with the layer. Along with the reset to source option, you can now Disconnect layer properties which will store all properties in the current web map. This effectively overrides any inheritance from the source layer properties, ensuring the web map remains exactly as authored. Note, however, that the data contained in the layer will continue to be referenced from the source layer.

Form authoring
You can now author forms directly in Map Viewer to create a tailored editing experience for your editors.
Improved support for location tracking layers
Location tracking layers have improved interaction in Map Viewer. When adding tracks to Map Viewer, they are automatically grouped,
Additionally, pop-ups automatically display location information similar to Track Viewer.
Other enhancements
- OGC WFS layers, as well as CSV layers added from url, now support filtering (look for smart mapping support for WFS in the next release!).
- Time-enabled bookmarks are now supported in the Map Viewer. This allows you to create bookmarks for specific time windows. To add a time-enabled bookmark, add a supported layer to your map and ensure that the time slider is open. Adjust the time slider to the desired time extent and then open the Bookmarks tool from the Contents toolbar and add a new bookmark. You will see the time extent displayed on the bookmark.

- Effects applied to the whole layer are now reflected in the legend as well (look for print support in the next release!).
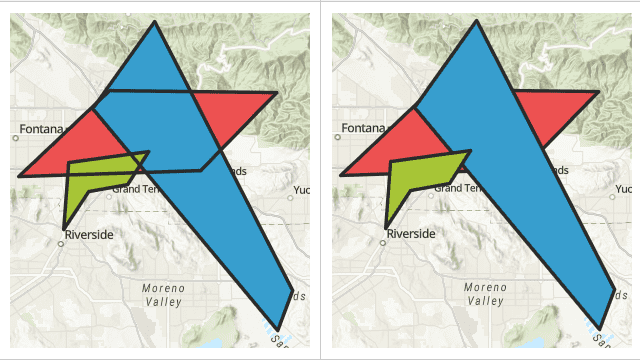
- Overlapping polygons have been improved so that outlines draw in the same order as the features on the map.
More resources
- Gain a better understanding of web maps created in the new Map Viewer versus web maps created in Map Viewer Classic with web maps and the new Map Viewer.
Participate on GeoNet to keep up on news , provide feedback, and join in discussions.

Article Discussion: