Map Viewer has lots of new features and enhancements with the June 2025 update. You can now drag and drop a file directly onto your map to launch the Add layer workflow. Want to update attributes for more than one feature at a time? No problem! You can now update multiple features’ attributes at once using the new selection tools available in the Editor pane.
Take your web maps to new heights with the new spike smart mapping theme. Using vertical symbols, or “spikes,” is a great way to quickly communicate sweeping trends and generate visual interest in your maps. Learn more about how to make your very own spike map in the styling and symbology section below.
Have any questions or feedback? Share an idea on the ArcGIS Ideas site or post a question in Esri Community. See What’s new in ArcGIS Online for the June 2025 update to explore more exciting capabilities outside of Map Viewer. Until the next update, happy mapping!

Quick links
Drag and drop
Effortlessly add files in Map Viewer by dragging and dropping directly onto your map. Prior to the June 2025 update of Map Viewer, files could only be dragged and dropped onto the Add Layer window. Now, the Add Layer workflow will automatically launch when supported files are dropped on the map.


Editing
You can now select multiple features when editing in Map Viewer using the new rectangle and lasso selection tools. Refine your list of selected features by using the layer picker, filter, or overflow options on the features.

When editing features, you can now delete, update attributes, and move up to 500 features in a single layer at a time. If you are familiar with ArcGIS Web Editor, you may recall that the ability to select and update attributes for more than one feature at a time was introduced in the last update of ArcGIS Online. Now, it is also available in other applications such as Instant Apps, Experience Builder, and more.
Additionally, you can now access shared editing templates published to ArcGIS Online, including group and preset templates.
Styling and symbology
Spike theme
Elevate your web maps with the new spike smart mapping theme. If you have a dataset that uses proportional symbols (or quantitative data), you will now see the option to apply Spike under the theme for Style options. The taller spikes represent larger values, and smaller spikes represent smaller values in your dataset.

You can customize the spike’s shape and style to take your dataset to new heights for points, polygons, or bins.
Generate style range
When styling layers, the entire dataset range is taken into account. Now you have the choice to style based on the current extent of your map (what is in view) or the entire dataset.

Additionally, spice up your symbols with new gradient fill and gradient stroke support. Gradient fills are available for the spike smart mapping theme and any web style symbols or hosted feature layers that were published from ArcGIS Pro with a gradient.

You can now apply the following smart mapping styles for subtype sublayers:
- Location (single symbol)
- Types (unique symbol)
- Counts and Amounts (size)
- Counts and Amounts (color)
- Predominant category
- Discrete Time Periods (category)
Sharing
Have you ever wanted a quick, easy way to share exactly what you are looking at in Map Viewer? Now you can share a link to a map with a single click. Simply zoom into your area of interest, click Copy link to map under Share map on the Contents (dark) toolbar, and paste it into a new browser tab. Voila! Sharing made easy.

Speaking of sharing, it has a new name! When sharing content in Map Viewer, you will find the sharing options underneath Manage sharing under Share map on the Contents (dark) toolbar.

Labeling
Labeling in Map Viewer has improved conflict resolution and positioning when working with multiple label classes. You can additionally label multipoint geometry as of the June 2025 update of Map Viewer.
ModelBuilder
ModelBuilder is now out of beta and in general availability for users with a Professional or Professional Plus user type.

ModelBuilder allows you to build models that chain analysis tools and data together, where the output of one tool becomes the input for another. Models are used to create multi-step workflows, ranging from routine tasks like managing spatial data to complex analysis workflows.
For more information, see ModelBuilder exits beta: now generally available in ArcGIS Online.
Sketch
Sketch layers now support drawing curves in Map Viewer. Simply choose the Curved line tool, then add two vertexes to determine the start and the end point of the sketch. Drag the middle vertex to define the angle and shape of the Bezier curve.
Curved sketches can be styled just like any other line shapes, including the symbol color, size, transparency and width.

Time
Time Series Arcade expression
Arcade savvy users can now animate sequential data in Map Viewer where each field represents a different point in time. With the help of a suggested Arcade expression, you can configure time series animations for ordered numeric fields that represent a distinct time. Useful for identifying trends and visualizing change over time, the layer must contain multiple fields containing numeric values that represent regular intervals (for example: Pop2000, Pop2005, Pop2010, etc.).

A template is provided for the expression where the only updates required are matching your field schema to the key variables that drive the animation. The inline documentation helps walk you through the process. After configuring the expression, setup the time slider to match your data including start and end dates as well as the interval that matches the interval of the fields in the layer.
Pro tip: you can easily update pop-ups and labels to display the appropriate attribute for the current interval by applying the same expression!

Watch for future updates to be able to configure attributes over time without requiring an Arcade expression.
Imagery
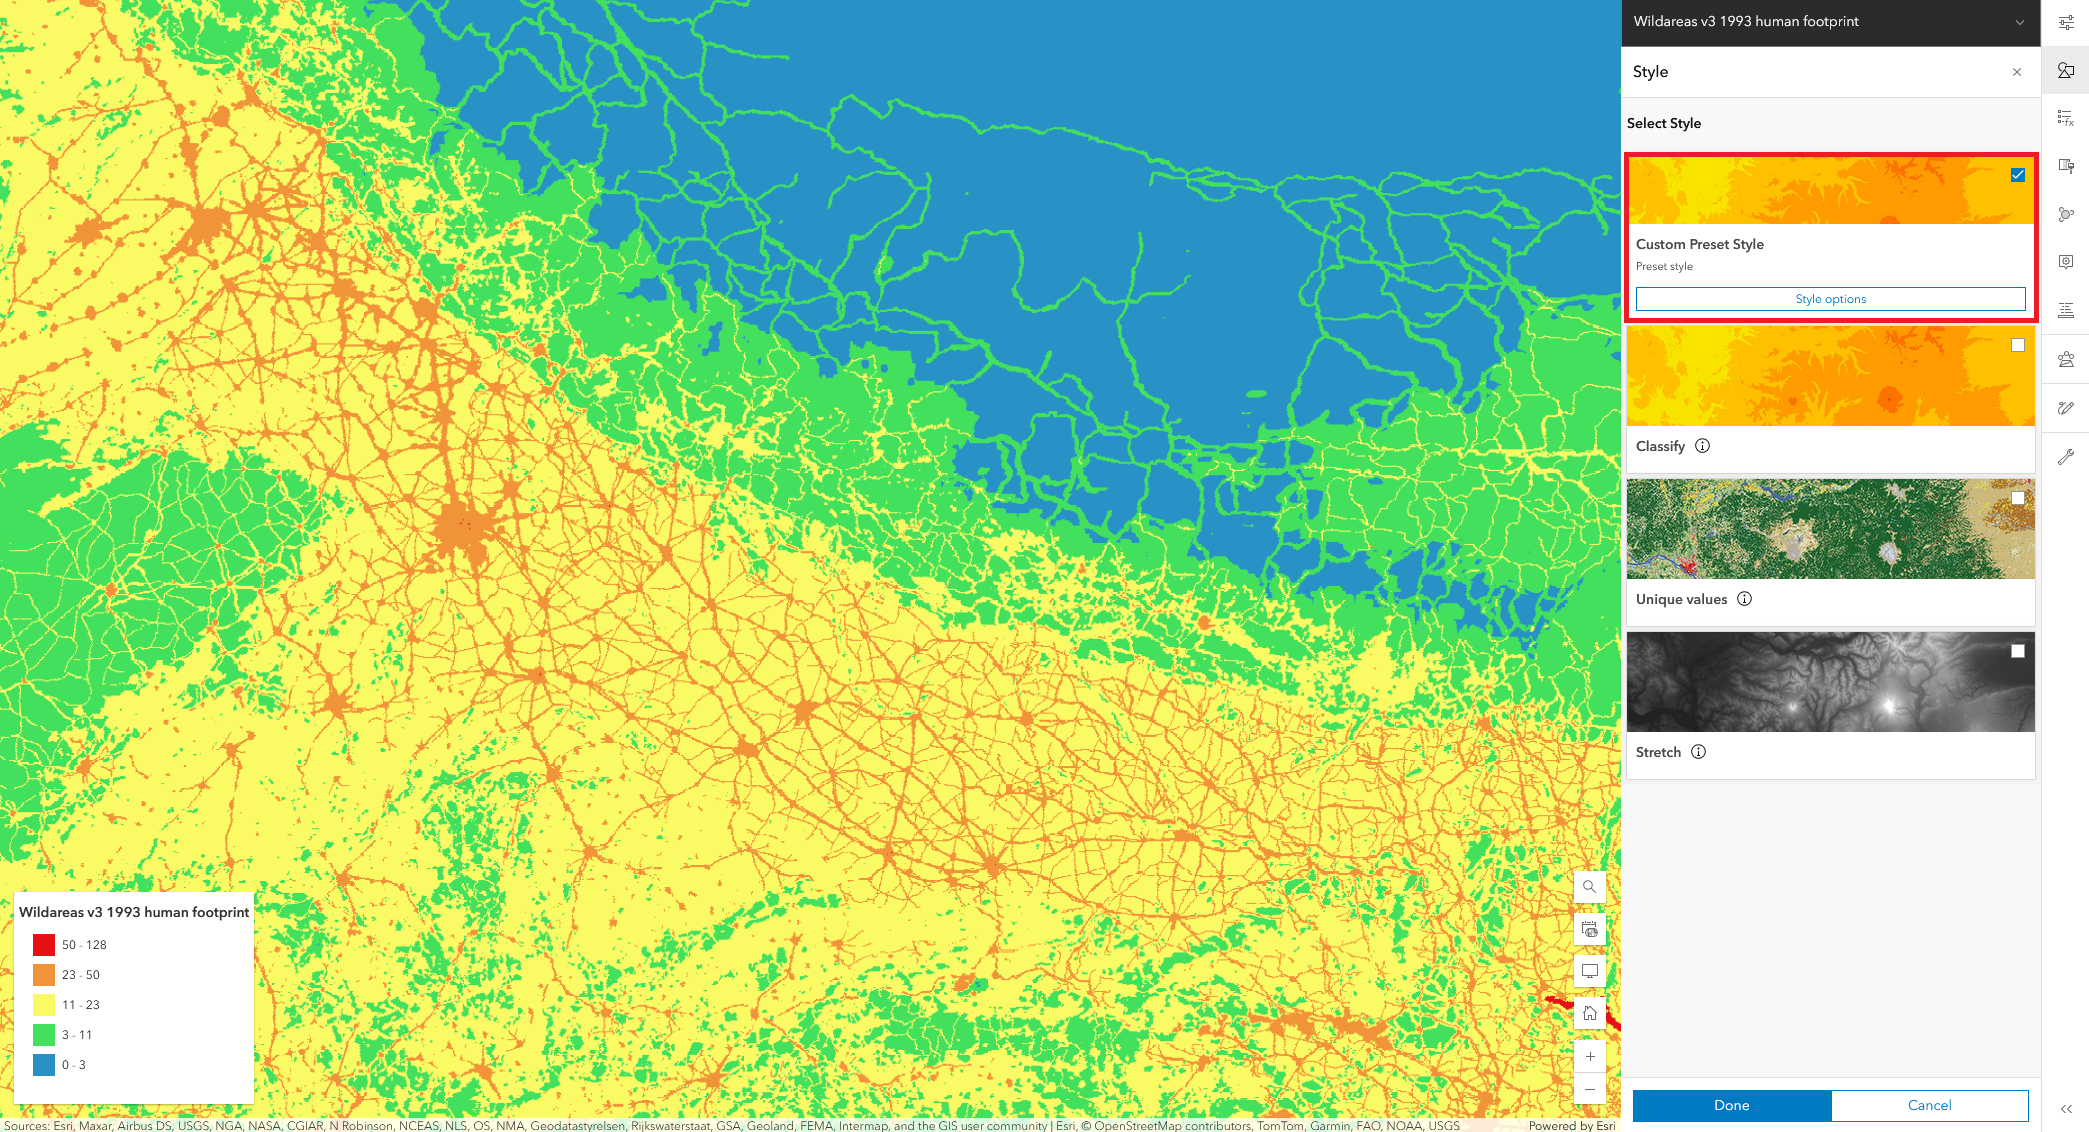
Customize your imagery layers by authoring preset styles in Map Viewer or ArcGIS Pro. Preset styles can be viewed and applied by anyone with access to the item. Try out preset styles when working with multidimensional imagery layers to swap between preconfigured layer visualizations.
Charts
Want to take your charts outside of ArcGIS Online? No problem. The new Export button in Map Viewer allows you to export your selected chart as an image or a table.

Also new as of the June 2025 update is the ability to re-order charts in the Charts pane. Drag and drop the charts and save your web map to persist the order of charts.

Directions
When getting directions and creating route layers, the distance and duration of each stop is now summarized in the route overview. This is particularly helpful for longer routes or multiple stops.

Other updates
Arcade assistant (beta)
Authoring Arcade expressions just got a whole lot easier with the new Arcade assistant (beta) available in Map Viewer. Located in the Arcade editor when applying styles and configuring pop-ups and labels, you can enter prompts or ask questions about your dataset to generate Arcade expressions. You can submit prompts to the Arcade assistant (beta) with varying levels of complexity, from changing the casing of an attribute field to creating custom HTML styled pop-ups.
 where the input prompt is to create a label for tree features with the full name and diameter in inches")
To learn more, see Introducing the ArcGIS Arcade Assistant (beta).
Map image layer item saving
Map Viewer now supports saving configurations for map image layers as a new and existing item. The Save options can be found both on the Layers pane and the Properties pane for the map image layer.
Indoor positioning data service (IPS) configuration
Configure indoor positioning data services without leaving Map Viewer. You can modify individual settings such as smoothing, GNSS, Apple IPS, and path snapping. Map Viewer also provides a quick option to restore to the default settings and seamlessly save a web map with IPS.

Commenting is not enabled for this article.