In June 2022, the ArcGIS API for JavaScript (ArcGIS JS API) added support for evaluating Arcade expressions on your terms. That means you can write and execute Arcade expressions in the context of your own custom Arcade profiles.
Arcade is an expression language that allows you to calculate values and create custom content in ArcGIS applications. It is designed to run exclusively in profiles, which define the execution context for expressions.

This post will demonstrate how you can create custom Arcade profiles in various scenarios.
First things first
This article is intended for developer audiences with prior knowledge of Arcade. If you are unfamiliar with Arcade and how it’s used, I strongly encourage you to read the following articles that establish a foundation for the principles demonstrated in this post.
Arcade profiles
The Arcade documentation refers to an expression’s execution context as its profile. A profile specifies:
- where you can use Arcade,
- the profile variables (aka globals) that can be used as input data values to the expression,
- the language functions you may use, and
- the valid data types that may be returned from an expression.
Another way to think of a profile is the environment that controls Arcade’s execution. There are more than 20 Arcade profiles implemented in various apps throughout the ArcGIS system, including ArcGIS Pro, ArcGIS Online, and the ArcGIS Developer SDKs.

When you may need a custom profile
The Arcade profiles already implemented in ArcGIS apps and developer products are sufficient for enabling users to customize apps in a vast majority of cases. However, there are a few scenarios where you may need to display the result of an expression in a custom element or use it as input for some other task. The following are common workflows that would require you to execute Arcade outside an existing Arcade profile.
- When you need to use the result of an expression defined in a web map outside the context of the map. The Execute Arcade expressions on your terms blog post demonstrates how to do this.
- When users need to customize content within the context of a custom-built configurable app similar to ArcGIS Online or ArcGIS Pro. This requires the developer to define their own profiles and provide the user with a text editor to author expressions.
- Developers may want to take advantage of Arcade’s simplified language syntax or leverage convenient Arcade functions not available in ArcGIS Developer APIs and SDKs.
This post will demonstrate the final scenario in this list using the esri/arcade module added in version 4.24 of the ArcGIS API for JavaScript. We’ll follow these steps in each example:
- Define the profile variables
- Write the Arcade expression
- Create an Arcade executor
- Execute the script
- Display the output
I’ll follow these steps to demonstrate how to create custom Arcade profiles for each of the following examples.
Time range
The DateDiff function in the Arcade language provides a quick and easy way to calculate the difference between two date objects.
var age = DateDiff(endDate, startDate, 'years');
An equivalent function doesn’t exist in JavaScript. Of course, you can write your own JS function to do this. However, if a function exists, then I’m more likely to use it.
In this example, I’ll demonstrate how you can create a profile that displays the duration of a time extent from a TimeSlider.
 of the time extent selected by the user. You can use Arcade to quickly calculate the difference between two dates and display it interactively to the user.")
Define the profile
Arcade requires a profile, or a context, in which to execute. The ArcadeExecutor creates this context based on profile variables provided by you. This allows the Arcade compiler to validate whether an expression is written for the right context.
When defining a custom profile, you can give the profile variables whatever names you want. Profile variables should always start with a $ character to avoid conflict with other variables declared in the script.
In the ArcGIS JS API, profile variables are defined as plain objects specifying the name of each variable along with its Arcade data type.
const timeRangeProfile = {
  variables: [
    {
      name: "$timeExtent",
      type: "dictionary",
      properties: [
        {
          name: "start",
          type: "date"
        },
        {
          name: "end",
          type: "date"
        }
      ]
    }, {
      name: "$unit",
      type: "text"
    }
  ]
};
Write the Arcade expression
The Arcade expression in this scenario simply takes the inputs from the profile variables and provides them to the DateDiff function.
const timeExpression = `
  Text(
    DateDiff($timeExtent.end, $timeExtent.start, $unit),
    "#,###"
  ) + " " + $unit
`;
Create an Arcade executor
Before executing the expression, it must first be compiled. The createArcadeExecutor method in the esri/arcade module compiles the script and validates it. If the script validates without compilation errors, the method will return an ArcadeExecutor object, which provides metadata about the expression and methods for executing it.
// Compile the expression and create an executor
const arcadeExecutor = await arcade.createArcadeExecutor(
  timeExpression,
  timeRangeProfile
);
Execute the script
Once the script compiles successfully, you may execute it as many times as you need using the execute function in the ArcadeExecutor.
To execute the script, you must hydrate the profile variables with valid inputs. This expression will return a new value each time the user changes the values of the slider thumbs.
function calculateTimeExtent ({ start, end }) {
  const timeLength = arcadeExecutor.execute({
    $timeExtent: { start, end },
    $unit: "days"
  });

  intervalValue.innerText = timeLength;
}

timeSlider.watch("timeExtent", calculateTimeExtent);
5. Display the output
Once the expression executes successfully, you can then use the result however you need it.
// DOM element to display the time duration
intervalValue.innerText = timeLength;

Label line segments
In this scenario, I’ll demonstrate how to use Arcade to create an experience for labeling line segments with various measurements while sketching geometries. This is something you could implement purely with JavaScript, but Arcade can help simplify the measurement calculations.

Arcade has a few geometry functions not available in the ArcGIS JS API’s geometry engine. These include angle, bearing, and distanceGeodetic, among others.
I’ll explain what each of these functions does and how I’ll use them for the segment labels.
Angle
The angle function calculates the arithmetic angle between two points, where a line pointing due east is zero degrees and a line pointing due north is 90 degrees.

var pointA = Point({
  x: 976259,
  y: 8066511,
  spatialReference: { wkid: 3857 }
});

var pointB = Point({
  x: 654435,
  y: 3056000,
  spatialReference: { wkid: 3857 }
});

Angle(pointA, pointB);
// returns 266.325
I will use Angle to calculate the angle of the label’s text symbol so it always runs parallel to the corresponding line segment.
Bearing
Bearing calculates direction in angular degrees clockwise from due north.

var pointA = Point({
  x: 976259,
  y: 8066511,
  spatialReference: { wkid: 3857 }
});

var pointB = Point({
  x: 654435,
  y: 3056000,
  spatialReference: { wkid: 3857 }
});

Bearing(pointA, pointB);
// returns 183.675 (i.e. South)
I will display the bearing of a line in the label text to indicate its orientation.
DistanceGeodetic
DistanceGeodetic calculates the geodesic distance between two points. The JS API geometry engine has a distance function that calculates the planar distance between two points, but not a geodesic equivalent. To calculate geodesic distance using geometry engine, you first need to create a Polyline geometry from a set of two vertices and provide the line as input to geodesicLength.
Alternatively, you could take advantage of the geodesicDistance function in geodesicUtils.
DistanceGeodetic in Arcade simplifies the workflow by accepting two points without the need for creating a new geometry or importing functions from different modules.
. The planar distance, represented with the red line, measures the distance between two points using Cartesian coordinates.")
var pointA = Point({
  x: 976259,
  y: 8066511,
  spatialReference: { wkid: 3857 }
});

var pointB = Point({
  x: 654435,
  y: 3056000,
  spatialReference: { wkid: 3857 }
});

DistanceGeodetic(pointA, pointB);
// returns 3563
Create the profile
Since the MapView (2D) doesn’t support segment measurements as you draw, I will use the Arcade functions described above to implement this experience myself.
In this case, I only need to define one profile variable that accepts the line feature being sketched in the view.
const labelSegmentProfile = {
  variables: [
    {
      name: "$feature",
      type: "feature"
    }
  ]
};
I want the expression to return a dictionary with two properties: a label, which is a dictionary of TextSymbol properties; and a location, which represents a point geometry marking the location of the label.
The returned dictionary in each expression should follow this specification.
const outputTypes = {
  label: {
    text: "Text",  // the label text
    angle: "Number",  // orientation of the label
    color: "Text",  // i.e. hex code or rgba string
    font: {
      family: "Text",
      style: "Text",
      weight: "Text",
      size: "Number"
    },
    haloColor: "Text",
    haloSize: "Number",
    yoffset: "Number",
    xoffset: "Number",
    horizontalAlignment: "Text",
    verticalAlignment: "Text"
  },
  location: "Point"  // point location of the label
}
Write and compile the Arcade expression
The expression will perform three calculations between each vertex in the line. It will use geodesic distance and the bearing in the segment label text. Angle will provide the value used to orient the label so it is parallel with the segment. I will also use the centroid function to find the midpoint of a line segment used to position the label.
The following expression returns the text symbol properties and the location to render the label.
// Expression for calculating measurements for active line segment
const labelSegmentExpression = `
  var paths = Geometry($feature).paths;
  var finalPath = Back(paths);
  var finalPoint = Back(finalPath);
  var previousPoint = finalPath[Count(finalPath)-2];

  var a = Angle(previousPoint, finalPoint);
  var b = Bearing(previousPoint, finalPoint);
  var c = When(
    (b < 22.5 && b >= 0) || b > 337.5, 'N',
    b >= 22.5 && b < 67.5, 'NE',
    b >= 67.5 && b < 112.5, 'E',
    b >= 112.5 && b < 157.5, 'SE',
    b >= 157.5 && b < 202.5, 'S',
    b >= 202.5 && b < 247.5, 'SW',
    b >= 247.5 && b < 292.5, 'W',
    b >= 292.5 && b < 337.5, 'NW',
    ''
  );

  var d = DistanceGeodetic(previousPoint, finalPoint, "meters");

  return {
    label: {
      text: Text(d, "#,###.#") + "m\\nBearing: " + Text(b, "#.#°") + " (" + c + ")",
      // symbol angle direction is opposite of Angle function
      angle: iif(b < 180, a * -1, a * -1 + 180),
      color: "black",
      font: {
        family: "Orbitron",
        style: "normal",
        weight: "bold",
        size: 9
      },
      haloColor: "white",
      haloSize: 1.5,
      yoffset: 4,
      xoffset: iif((b <= 180 && b > 90) || b >= 270, 4, -4),
      horizontalAlignment: "center",
      verticalAlignment: "bottom"
    },
    location: Centroid([previousPoint, finalPoint])
  };
`;

// Compile the expression and create an executor
const arcadeExecutor = await arcade.createArcadeExecutor(
  labelSegmentExpression,
  labelSegmentProfile
);
Notice how Arcade overloads functions, like Centroid, for convenience. In the ArcGIS JS API, I would either be required to write my own centroid function, or convert the two points to an extent object to get the centroid.
Create the labels and add them to the view
Once the expression compiles, I execute it for each mouse movement while the user constructs a line. The outputs are converted to their proper JS API classes so I can add the label to the view.
// create label symbol and position
const { label, location } = arcadeExecutor.execute({
  $feature: graphic
});

let activeLabel = new Graphic({
  symbol: new TextSymbol(label),
  geometry: location
});

labelLayer.graphics.add(activeLabel);


Summary statistics
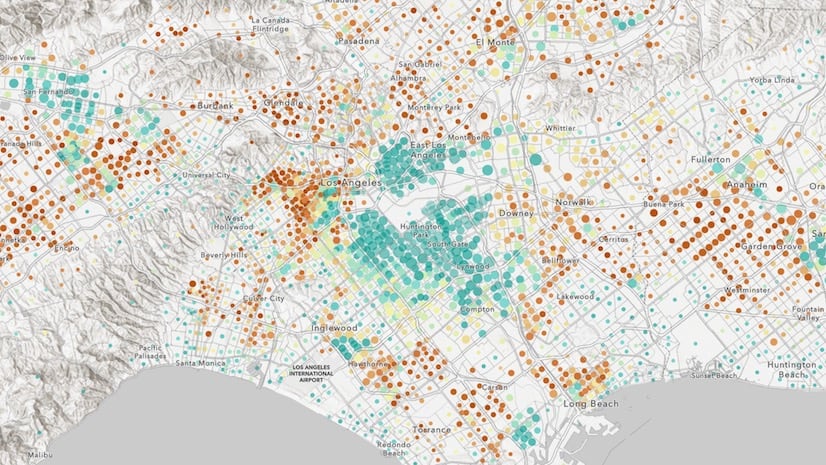
This final scenario will demonstrate how to use Arcade to calculate summary statistics queried from a feature service and displayed in an element outside the popup.
I created this app that allows the user to click a location in the San Diego area, and view statistics for the top five crimes apprehended within a distance of that point.
Create the profile
This profile’s variable definitions look like the following:
const dataProfile = {
  variables: [
    {
      name: "$mapClick",
      type: "geometry"
    },
    {
      name: "$bufferProps",
      type: "dictionary",
      properties: [
        {
          name: "distance",
          type: "number"
        },
        {
          name: "units",
          type: "text"
        }
      ]
    }
  ]
};
The expression will take the click location, and create a buffer based off the input distance. Once the expression evaluates, the summary statistics will be returned as an HTML table alongside the buffer geometry.
Write and compile the Arcade expression
While it executes, the expression creates a FeatureSet from a portal item containing data for crimes committed in San Diego. It then queries the top five crimes reported within the buffer using a series of chained functions.
const arcadeExpression = `
  var p = Portal('https://www.arcgis.com');
  var features = FeatureSetByPortalItem(
    p, '03c5236e3d7f496baca4c992f3c2e89c', 0, ["is_night", "type"], true
  );

  var bufferGeometry = BufferGeodetic(
    $mapClick,
    $bufferProps.distance,
    $bufferProps.units
  );

  var topCrimes = Top(
    OrderBy(
      GroupBy(
        Intersects( features, bufferGeometry ),
        "type",
        [
          { name: "total", expression: "1", statistic: "count" },
          { name: "nightPercent", expression: "is_night", statistic: "avg" }
        ]
      ),
      "total desc"),
    5
  );

  // Rest of the expression builds an HTML table
  // ...removing to conserve space

  return {
    table: table,
    buffer: bufferGeometry
  };
`;

// Compile the color variable expression and create an executor
const dataArcadeExecutor = await arcade.createArcadeExecutor(
  arcadeExpression,
  dataProfile
);
Execute the expression and display the results
The result is returned as an HTML table that can then be added as content to a DOM element or web component in your app.
view.on("click", async ({ mapPoint }) => {
  const distance = distanceSlider.values[0];

  const { table, buffer } = await dataArcadeExecutor.executeAsync({
    $mapClick: mapPoint,
    $bufferProps: {
      distance,
      units: "miles"
    }
  }, {
    spatialReference: view.spatialReference
  });

  displayDiv.innerHTML = table;
  addBufferToView(buffer);
});

You may reasonably ask, “Why would I do this when the ArcGIS JS API already allows me to query statistics with better performance?” This is true. The layer view query functions available in the ArcGIS JS API provide a smoother experience for querying data.
However, Arcade can be a good solution since it abstracts a lot of the quirks that exist for querying data between server versions, database types, and layer types when it comes to querying statistics. Some functions are made available for newer services but aren’t in older ones. Arcade also paginates queries in your behalf, whereas you would need to do this on your own in JavaScript.
In summary, Arcade allows you to use a consistent syntax to query data from all kinds of sources. In other words, you can use the same expression for a variety of sources without needing to check version numbers, make exceptions, or worry about pagination.
Conclusion
Defining a custom profile is more meaningful when you provide an experience allowing users in an app builder to configure their own experience with Arcade. Examples of this scenario include apps like ArcGIS Online Map Viewer, ArcGIS Dashboards, ArcGIS Velocity, ArcGIS Pro.
However, as demonstrated in the examples above, you can certainly use the Arcade executor to create profiles for any purpose you want. If you have a custom profile in mind, let me know about it! I’d love to see how you create custom Arcade profiles in your web apps.


Have any Arcade syntax highlighting extensions been developed for IDEs such as Visual Studio Code or VSCodium? It looks like all the Arcade code is written inside of strings, so it would be nice if there was a way to highlight the Arcade code within those strings.
We don’t have any IDE extensions at the moment. Currently, your best bet is to use the Playground/Arcade editor, which is an IDE of sorts. We’re also completely redeveloping it to make the expression authoring experience much nicer…better debugging tools, intellisense, formatting options, etc. It is essentially becoming a full-fledged IDE. Because we are using Monaco to develop the new editor, we are considering also releasing an extension for VS code…
Apparently, I’m not allowed to post links here, but you can find the Playground in the core Arcade documentation.