A lesser-known, but powerful, feature of the ArcGIS API for JavaScript (JS API) is the ability to create dynamic MapImageLayer sublayers from data in dynamic workspaces.
A while ago, I wrote about how you can generate data-driven visualization styles for dynamic layers using the 3.x series of the JS API. As of version 4.7 of the JS API, you can now generate these visualizations with more intuitive, readable code. This post will demonstrate how to create this 3.x JS API web app with TypeScript using the ArcGIS API 4.8 for JavaScript.
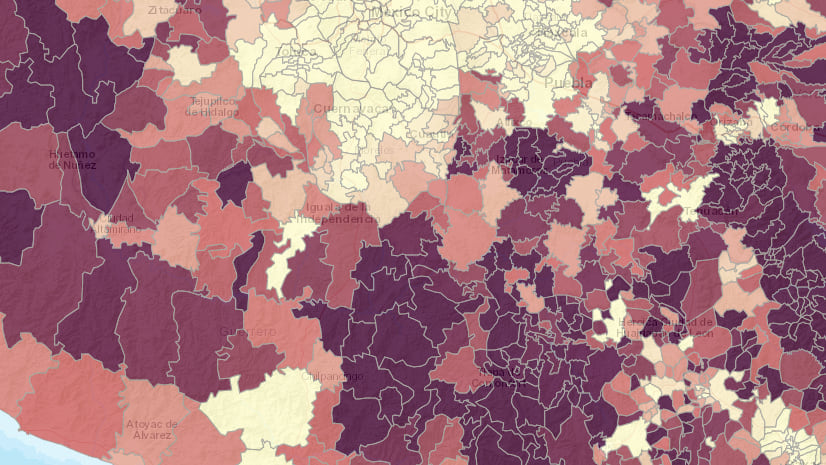
This sample allows you to explore ancestry data in the United States. It demonstrates how to do the following:
1. Join a non-spatial table with ancestry data from a dynamic workspace to a layer with geometries representing U.S. states
2. Generate a meaningful visualization of the joined attributes using a Smart Mapping renderer creator method
This is doable with the 3.x JS API as seen in the original app, but is a little inelegant and cumbersome. The 4.x JS API makes the workflow for creating this app simpler thanks to the following:
- Autocasting
- A helper method for creating a FeatureLayer directly from a MapImageLayer Sublayer
- Support for generating renderers with Arcade expressions
- Simplified APIs for updating a Sublayer’s renderer and popup
Autocasting
Autocasting eases the coding workflow by automatically importing necessary modules. The 3.x app requires manually adding 17 module imports. The 4.x version of the app only requires manually adding five module imports.
Constructing the joined dynamic layer in 3.x involves ~80 lines of code, but can now be done in about 25 lines using 4.x.
const layer = new MapImageLayer({
  url: "https://sampleserver6.arcgisonline.com/arcgis/rest/services/AGP/Census/MapServer",
  title: "United States Population",
  listMode: "hide-children",
  sublayers: [{
    title: "% population with selected ancestry",
    id: 0,
    opacity: 0.75,
    source: {
      dataSource: {
        leftTableSource: {
          mapLayerId: 3  // states sublayer
        },
        rightTableSource: {
          dataSource: {
            workspaceId: "CensusFileGDBWorkspaceID",
            dataSourceName: "ancestry"  // non-spatial table
          }
        },
        leftTableKey: "STATE_NAME",
        rightTableKey: "State",
        joinType: "left-outer-join"
      }
    }
  }] as esri.Sublayer[]
});
Notice you don’t even need to specify which type of dynamic layer sources you need for each side of the join. The API figures it out for you.
Create a FeatureLayer with a dynamic source directly from a Sublayer
Starting at version 4.7, you can create a FeatureLayer with a dynamic source directly from a Sublayer. This is done with the createFeatureLayer() method on the Sublayer class.
In 3.x, you have to construct a new FeatureLayer, referencing the dynamicLayer endpoint in the URL, and set the same source you created for the Sublayer in the constructor options.
var layerOptions = {
  mode: FeatureLayer.MODE_SELECTION,
  outFields: ["*"],
  source: dynamicLayerDataSource
};
featureLayer = new FeatureLayer(layerUrl + "/dynamicLayer", layerOptions);
In 4.x, you simply call the createFeatureLayer() helper method.
const ancestrySublayer = layer.sublayers.find(function(sublayer: esri.Sublayer) {
  return sublayer.title === "% population with selected ancestry";
});
const ancestryFeatureLayer = ancestrySublayer.createFeatureLayer();
You can use a FeatureLayer instance to verify the join was successful by setting a breakpoint in your developer tools and checking the fields array on the layer.
A FeatureLayer instance is required for this app because generating a renderer with a Smart Mapping method requires either a FeatureLayer, CSVLayer, or SceneLayer. However, the renderer generated from Smart Mapping can be applied back to a MapImageLayer sublayer.
Generate a renderer with Arcade
This app allows you to explore ancestry data in the United States, while demonstrating how different classification schemes can affect a visualization. To generate the appropriate renderer I use the createClassBreaksRenderer() method on the colorRendererCreator Smart Mapping module.
All that’s needed for the renderer creator method is a basemap, a FeatureLayer, and a field name. You can optionally change the classification method, which I exposed as an option to the user for educational purposes.
In the 3.x app, the field selected by the user in the dropdown menu is passed to the field parameter and normalized by a total population field. This works for creating a good visualization, but it makes the legend look awkward since all values are ratios (values between 0 and 1). I added extra logic to format the labels of the generated class breaks as percentages since it makes the legend easier to read and comprehend.
Smart Mapping now supports Arcade expressions, which means you can pass an expression that returns a number instead providing the name of a numeric field. In the 4.x version of the app, I use an Arcade expression for formatting the ancestry to population ratios as percentages. Now I don’t have to loop through the breaks and modify the labels later on in the app.
const params = {
  layer: ancestryFeatureLayer,
  basemap: map.basemap,
  valueExpression: `Round( ( $feature['${ancestrySelect.value}'] / $feature['states.POP2007'] ) * 100, 1);`,
  view: view,  // required with valueExpression
  classificationMethod: classSelect.value
};

const response = await colorRendererCreator.createClassBreaksRenderer(params);
Since this app is written with Typescript, you can take advantage of template literals when constructing the Arcade expression used as the basis for the data-driven visualization. I also take advantage of async/await since it simplifies the structure of the code.
Update a Sublayer’s renderer and popup
Updating MapImageLayer sublayer properties in 4.x, such as the renderer and popupTemplate is much improved. In 3.x you have to do the following just to update the renderer of one sublayer.
var optionsArray = [];
// Create a LayerDrawingOptions object used to set
// a renderer on a sublayer of a DynamicLayer
var drawingOptions = new LayerDrawingOptions();
// Update label in legend for each break
var breaks = response.renderer.infos;
breaks.forEach(function(breakInfo, i){
  var max = Math.round(breakInfo.maxValue * 1000) / 10;
  var min = Math.round(breakInfo.minValue * 1000) / 10;
  breakInfo.label = min + "% - " + max + "%";
});
// Remove the default symbol so it doesn't display in the legend.
delete response.renderer["defaultSymbol"];
// Set the response renderer on the drawing options
drawingOptions.renderer = response.renderer;
// And place the drawing options in index 3 so it applies to the states sublayer
optionsArray[3] = drawingOptions;
// set the renderer on the layer
censusMapServiceLayer.setLayerDrawingOptions(optionsArray);
In 4.x, it takes just one line of code after waiting for the promise returned from the renderer creator to resolve.
const response = await colorRendererCreator.createClassBreaksRenderer(params);
ancestrySublayer.renderer = response.renderer;
Updating the popupTemplate similarly is done by setting the popupTemplate property directly on the Sublayer instance.
ancestrySublayer.popupTemplate = {
  title: "{states.STATE_NAME}",
  content: `{ancestry.${selectedAncestry}} of the {states.POP2007} people
    in {states.STATE_NAME} have ${selectedAncestry} ancestry.`,
  expressionInfos: [{
    name: "per_ancestry",
    expression: response.renderer.valueExpression
  }],
  fieldInfos: [{
    fieldName: "states.POP2007",
    format: {
      digitSeparator: true,
      places: 0
    }
  }, {
    fieldName: `ancestry.${selectedAncestry}`,
    format: {
      digitSeparator: true,
      places: 0
    }
  }]
} as esri.PopupTemplate;
Once again, here’s the final app, along with the source code.
Summary
The ArcGIS API for JavaScript version 4.7 or greater provides a better coding pattern for generating renderers for MapImageLayer sublayers. The same functionality works in 3D SceneViews. However, if you would like to take advantage of 3D symbology, you’ll need to add the dynamic FeatureLayer instance to the map rather than the MapImageLayer since MapImageLayer doesn’t support 3D symbology.
A lot of what was discussed in this post assumes some prior knowledge of key concepts of MapImageLayer and Smart Mapping. To read more about these topics, I recommend the following:
1. What’s the deal with MapImageLayer – This blog provides a nice overview of how to use dynamic layers in web apps and how to set up a dynamic workspace on your server.
2. Using Smart Mapping in custom web apps – I’ve written a number of blogs on how to build data exploration apps with the smart mapping tools available in the JS API. Here’s one to get you started.
3. Generate Arcade expressions for data exploration web apps – If you’re unfamiliar with Arcade, I encourage you to read this post about generating Arcade for use in data exploration web apps.
The 4.x version of the sample app was written in Typescript. If you are new to TypeScript, or developing web apps in TypeScript with the JS API, I encourage you to read this blog and this guide, which discuss the benefits of developing with TypeScript and help you with getting started.
A non-Typescript version of this app can also be explored in the ArcGIS API for JavaScript documentation.


Commenting is not enabled for this article.