Note: This article was written in December 2019. For the latest updates regarding themes in dashboards, please read Elevate your dashboard design with new themes.
Cyndi Lauper famously sang that she sees your true colors – and thinks they’re beautiful. Sadly, there’s no guarantee that Ms. Lauper will be the one looking at your dashboard, so when using ArcGIS Dashboards, putting some thought into the color choices you make is an important step of the creation process.
Color has the ability to provide context, connect information, evoke authority and draw attention. Choosing to customize the colors of your dashboard – or not (leaving them as their defaults) – is a design choice that you will need to make as a dashboard author. So how do you make this choice?
The first step in choosing the right colors for your dashboard is to ask yourself some questions:
- Who is this dashboard for?
- Where will this dashboard be seen?
- Do I want my audience to notice something in particular? If so, what?
Answering these questions will help you determine the best colors for your dashboard.
Colors have context
Context is important when choosing colors for your dashboard. Colors can have meaning when it comes to emotions and these meanings can vary by region and culture. If your dashboard is trying to evoke feeling, the use of color can help or hinder that effort. Understand the meaning of color to your audience. Will using the color red indicate to your audience that the data they’re seeing is negative or does the color hold a positive connotation in that region?
Colors can also have symbolic meanings or specific associations which can also be regional and culturally specific. For example, if you’re creating an election dashboard, you may want to use the colors associated with the involved political groups to clarify and give more context to your dashboard’s purpose.

The dashboard above shows election results in the county of DuPage, Illinois. At a glance, it’s easy to see that the winner was from the Democratic Party since that party is associated with the color blue in the United States. However, it’s important to realize that the context of these colors is regional and that they are associated with those political parties in the United States and not necessarily anywhere else. It’s also important to remember that even within the same region, not everyone will understand the symbolism of your color choice so try not to have color be the only method you use for giving context to your data.
Use colors to connect information
Choosing the right colors can help connect the different information your dashboard is displaying.

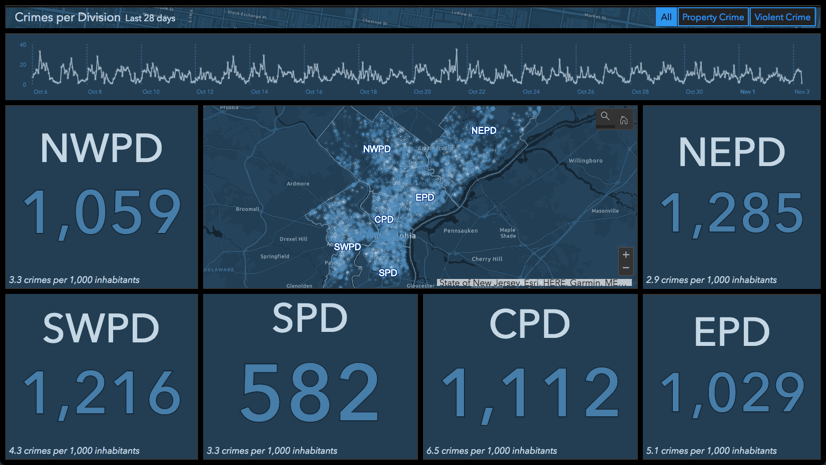
In the dashboard above, the colors used for the indicators match up to the symbols displayed on the map. This helps connect that these two bits of information, while displayed on different elements, are the same.
A similar strategy can be done for matching the colors of your charts (pie or serial) to your map element to provide consistency for your audience and in some ways, it can also serve as a legend for your map. For example, in the dashboard below, the colors used in the serial chart (indicating alert level) are the same as those used on the map, which is displaying the same information.

As you can see, the map on the dashboard doesn’t have a legend, but because the serial chart uses the same colors, you can easily connect the two and identify what the colors on the map represent.
Use color to evoke authority
Authority can come from many places and can be reinforced with the use of the right colors. One way to evoke authority is by choosing colors that are appropriate for the dashboard’s purpose. A dashboard showing serious information, for example, a dashboard showing the spread of disease or emergency evacuation efforts, should limit their color pallet and stick to more neutral tones as to not take away from the seriousness of the information. Using bright shades of pink and orange might seem fun but may not be appropriate for the subject.
Authority can also come from your organization or brand, which likely already carry some level of authority with your audience. Because of this, consider aligning your dashboard’s colors with those of your organization or brand. The header element is a good place to do this. It can help reinforce the authority of your dashboard and more importantly, the authority of your data.

The dashboard above shows mission statistics for the GISCorps organization. In this case, the organization’s main color is a specific variation of blue – which was brought into their dashboard. Doing this helps to indicate that the dashboard is linked to the organization, giving their audience a better sense of trust.
Use color to draw attention
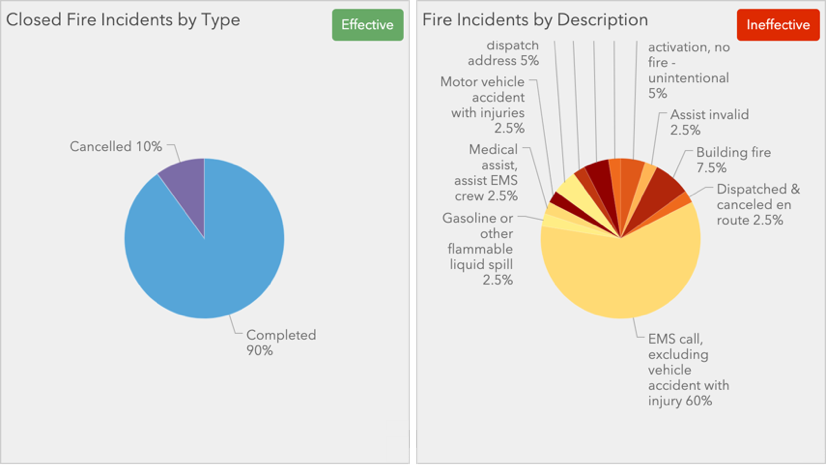
Two words – contrasting colors. Contrasting colors can help make a dashboard easy to read and let you decide what information should stand out. When it comes to making a dashboard easy to read, the most basic rule is – light text should be on darker backgrounds and vise-versa. You want your audience to be able to understand your dashboard easily and not struggle to read important information.

The indicators above are an example of how contrasting colors can make reading easier. The indicator on the left uses light text on a dark background and all the text can be easily read. On the right, the same indicator has a dark purple text on a black background. While you can still see the big number in the middle, it’s hard to read the text at the top and it’s almost impossible to read the “Last update” text.
Contrasting colors are not only easier for reading, but they can also be used to focus your audience’s attention. When a color is standing out from the rest of the screen, your eyes are naturally drawn to it. If your entire dashboard is neutral tones and you have one element, for example an indicator, that’s red, your audience is likely going to look at that element first because it stands out.
Start using color
Now that you’ve learned some strategies for choosing the right colors for your dashboard – you can start incorporating them into your current or future dashboards.
You can go to the dashboard settings menu to define text and background colors for your entire dashboard or customize the colors of each element individually. Some elements also have other components besides text and background with customizable colors, including charts, which have colors for each category or series. The General tab of an element’s configuration menu is where you will find your basic color settings and elements with different components have more specific color settings in their individual setting tabs. You can choose a color from the color palette provided or enter your own color as a hexadecimal (hex) code.
Some other things to keep in mind:
- Consider the basemap that you choose for your map element and make sure it works with the rest of your dashboard’s colors.
- Use a color tool to extract colors from elsewhere (website, images, basemaps, etc..) to use throughout your dashboard for a more uniform color scheme.
- While strategic and meaningful color choices are important, don’t lose sight of the overall look and feel of your dashboard. Any choice you make should still be visually appealing.
Have fun playing around with you color choices and discovering what works best for you. Remember that color choice matters – data visualizations are only as good as their design. Thinking about your color choices is a great start to authoring a great dashboard.
The ArcGIS Dashboards team at Esri love to see what you create. If you are able, please share your dashboards on Twitter or LinkedIn with #ArcGISDashboards
Card and banner photo by Copper and Wild on Unsplash

Article Discussion: