In our increasingly digital world, utilities have greater access to real-time information on the operating conditions, performance, and health of their infrastructure. This enables more efficient operations and better-informed planning decisions, more proactive response to network events, and more preventive or predictive maintenance of critical assets. Data can come from a wide range of sources—field applications, SCADA platforms, Internet of Things (IoT) devices, automatic vehicle location (AVL) systems, weather forecasts, and social media. This large amount of data can be overwhelming, quickly becoming dark data—data that is gathered and stored, often in departmental silos, but not used in any meaningful way.
The value of a dynamic, holistic view of system conditions cannot be overstated. During outages, extreme weather events, and other emergencies, mounting a proactive, coordinated response is crucial. Esri’s real-time data integration capabilities are designed to turn data into actionable information, enabling staff to visualize and analyze real-time data across both time and space, regardless of source. This provides an at-a-glance view of where individual data feeds are and how they relate to each other, customers, assets and network processes, and events. Viewing data within charts, graphs, maps, dashboards, and more turn dark data into meaningful and actionable content. Feeding this data into Esri’s analytics and third-party partner machine learning applications provides optimization and prediction tools that support operations, maintenance, and investment planning decisions.

Hampton Roads Sanitation District (HRSD) in Virginia Beach, Virginia, provides wholesale wastewater treatment services to 18 cities and counties across a 3,100-square-mile service area. HRSD integrates real-time data from its OSIsoft PI data historian and Telog data logger fleet. They transmit live readings from approximately 200 flowmeters, 200 pressure sensors, and 70 rain gauges—to its ArcGIS office and field applications. Operations and maintenance staff access up-to-date information on network conditions from anywhere in the field to monitor and manage critical infrastructure during wet weather and high tide events, while office staff access and analyze historical data on system performance over time.
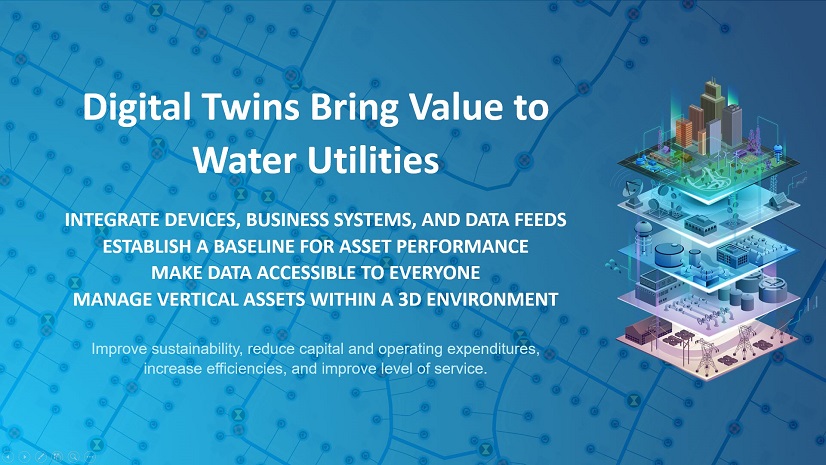
Real-time data integration also enables utilities to turn static engineering and design models into dynamic replicas of real-world assets and processes. These models can be used to optimize asset management and investment decisions, monitor real-time operational performance, and simulate network events and scenarios for planning and training purposes.

ArcGIS plays a critical role in the White House Utility District’s (WHUD) real-time water loss program, providing the foundation for what is essentially a dynamic digital twin—a virtual model of its sectorized distribution network, which replicates and reflects real-world network conditions and events as they unfold. The utility uses ArcGIS to integrate all critical information, including real-time flowmeter data and field crew updates, with custom-configured office dashboards and field applications. Every morning, WHUD’s water loss analysts consult these dashboards for up-to-date readings from their district metered area flowmeters. Potential problem areas are identified on a color-coded GIS map of their service area. Dollar values of lost water are displayed for each DMA in the district. Staff can usually pinpoint a leak within hours—a drastic reduction in time, cost, and water loss. WHUD’s engineering team estimates the total direct savings of the program to be US$1 million per year, with more than US$200,000 of that coming from early leak detection.
Utilities using Esri technology to integrate, view, and understand their data also have many tools available within ArcGIS to share this data. Sharing data more broadly with regional partners, regulatory agencies, and the public can improve planning, coordination, and response, making communities safer and more resilient.
Over 90 percent of the 500 largest US utilities use ArcGIS for water, wastewater, and stormwater infrastructure management. The ArcGIS system that your utility has likely already invested in for mapping can do so much more for your organization. ArcGIS capabilities range from facilitating better coordination and collaboration between field and office staff to visualizing and analyzing real-time data from across your service area to providing more precise, granular models of the performance and behavior of your critical plant and network assets.
What steps can you take to start your real-time journey?
- Deploy Web GIS-based solutions (ArcGIS Field Maps, ArcGIS Survey123, ArcGIS Dashboards) for field and plant staff that enable real-time updates and interaction to ensure everyone has a common operational view.
- Implement real-time processing capabilities using an on-premises solution (ArcGIS GeoEvent Server) or software as a service (SaaS)-based solution (ArcGIS Velocity).
- Identify workflows that would benefit most from the integration of existing real-time sensors. An example could include ensuring office dispatch staff can access AVL data through an ArcGIS Dashboards app in the office.
- For future IoT purchases, work with hardware vendors that expose their real-time data feeds to ArcGIS through APIs, web services, and common cloud IoT platforms.
To learn more about real-time integration and digital water transformation, download the new report “GIS & Digital Water: The Foundational Role of GIS in Digital Water Transformation.”
About the author