This is Part 3 of a 4-part series rounding up the latest features related to data interoperability, enterprise integrations, ArcGIS extensibility, and open source analytics. These features highlight key advantages of the ArcGIS open platform architecture. We’ve looked back through the past several months of blogs and videos and picked out the most important related announcements. With the distraction of global pandemics and all the other feature goodies, we wanted to make sure you chief technical officers and developers didn’t miss these new features and how-to’s from across the ArcGIS platform.
Part 3 focuses on how developers can flex the ArcGIS platform to meet your organizations particular needs. If you want all the recent updates by product instead, see this Q1 ArcGIS Release roundup.
Customize to Meet Your Unique Needs
When ArcGIS products don’t match your exact needs, you can usually tailor or extend them to meet your unique requirements using modern, open ArcGIS APIs and Software Development Kits. If the dozens of configurable apps or low-code app builders aren’t enough, you can create your own with the ArcGIS Runtime SDK or API for Javascript. The updates below discuss new options when creating your own mobile or web mapping applications, using third party content, and customizing the ArcGIS Desktop experience.
Using Non-Esri Basemaps and Data in Your Custom Web Apps
Let’s say you want to combine Esri and non-Esri data assets directly into your custom web application using the ArcGIS API for JavaScript. When selecting a basemap for your custom apps, you can use third party vector tiles in addition to Esri maintained raster and vector tile basemaps. You can load them into the API, regardless of their origins. The vector tile layer consumes vector tiles and is styled using a common style specification.
Then when adding data into your application, the common GeoJSON layer is now a first-class citizen in the JS API v4.x, allowing you to pull from virtually any web platform. You can style it, perform client-side queries, filter, and calculate statistics, and now enable clustering in the same way that you would with a Esri feature layer. Explore the JS API samples on developers.arcgis.com to see how you can work with GeoJSON, CSV, OGC, and tiled layer types. Read more about support for other open formats, or learn more about other new JS API features.
Customize the Style of your Vector Basemaps
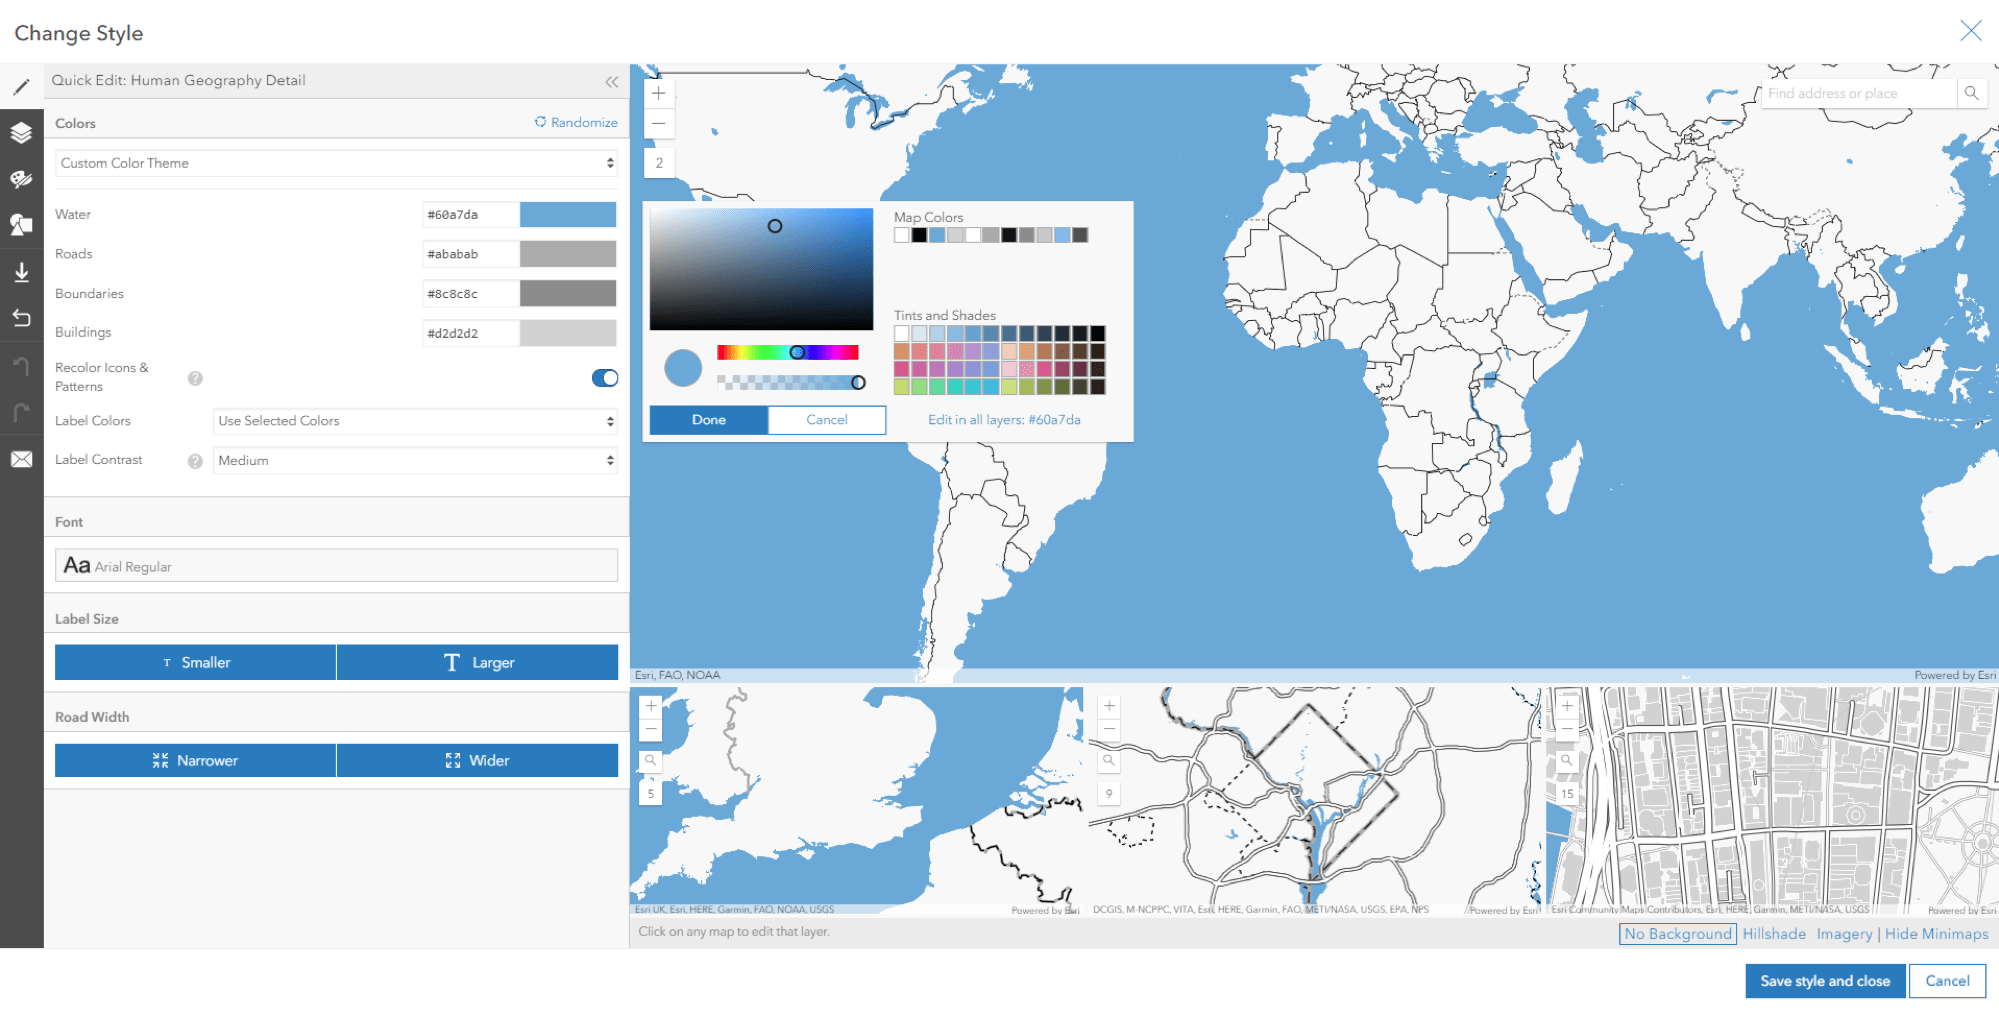
Want to use Esri’s Open Street Map vector basemap in your custom application, but accentuate parks or water bodies? You can now customize styles to any of Esri’s Vector Basemaps using a simple web application. Change colors. Replace fonts. Turn off layers. Even simple changes can make a big impact. Save as many as you want for reuse with an ArcGIS Online or Enterprise user account, or get a free ArcGIS Developer account. You can access the Vector Tile Style Editor app from the Change Style icon under any Esri Vector Basemap layer. Learn more about using this app. For more involved changes, such as revising disputed boundary lines, see the Reference Document for how to make more involved changes. Or learn more about What’s New in Esri Vector Basemaps.
Make Custom Dynamic Symbols in Your Custom Web Apps
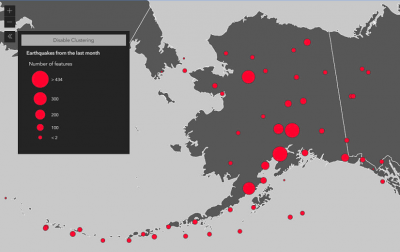
Let’s say you want to map citizen reports from your city’s 311 service. And you want each report to have a custom picture symbol based on the report – pothole, street light out, etc – AND have each symbol get bigger the longer that report has an “Open” status. And then also make all other reports with a “completed” status a simple grey dot. Now you can, using the new custom Dictionary Style and rule engine, you can dynamically generate custom symbols for each feature in your own web maps and applications. Symbols can dynamically generate based on based on multiple attributes of a feature.
The feature leverages the Cartographic Information Model (CIM), Esri’s open specification for symbology and portrayal represented in JSON and used across ArcGIS clients. Check out this overview demo (9 min) here, or skip to the JS implementation part below. This video highlights this application using the standard symbology definitions used across military forces. #arcgisarcadedictionarywebstylin #sayWHAT?
Streamline the User Experience in the ArcGIS Desktop
If you have a large organization with specialized user types and roles, you might want to reduce the complexity for them. With the ArcGIS Pro SDK, you can customize many aspects of the ‘look and feel’ of our powerful desktop client. Starting with ArcGIS Pro 2.5, using the Content API, developers can now create and configure browse dialog filters for use with the OpenItemDialog to control what can be browsed to, and the SaveItemDialog to control what options are visible in particular workflow scenarios.
For example, when adding an item to a project, maybe you want to limit the item type options a user sees in the window to only imagery, polygons and and machine learning models relevant to her typical analysis flow. This customization could be made in Add-Ins or within the core UI options of Pro. Esri solutions partners have successfully deployed this approach for users in specific industries.
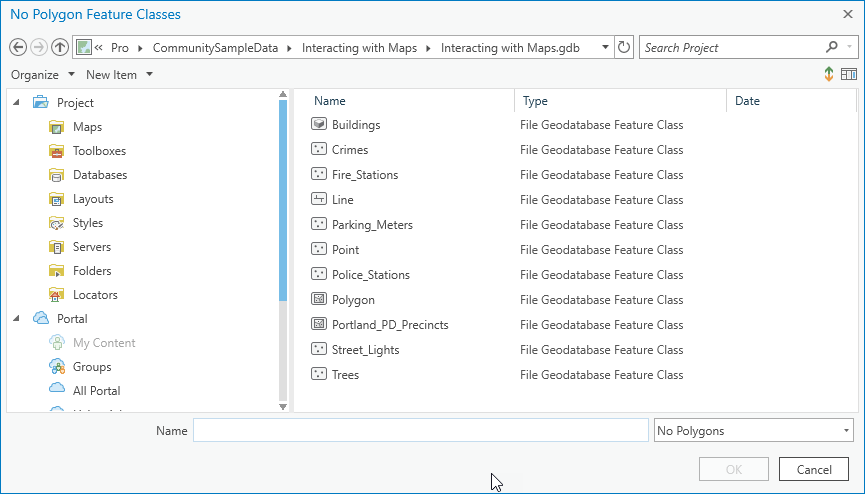
This new particular capability can further support specific types of analysts who might get distracted or overwhelmed by content not necessary to their workflows. This feature builds on earlier custom items capabilities discussed in the Browse Dialog Filters section of the Content ProConcepts document. To get started, see the ProGuide Custom Browse Dialog Filters document and explore the community sample in your own add-ins.” Browse the videos from the ArcGIS Pro Customization Sessions from the March 2020 Dev Summit, starting with the introduction video below. Or learn more about What’s New in the ArcGIS Pro SDK.
Up Next
So that rounds out Part 3. Go back to Part 1 or 2, or stay tuned for the rest of the series.
- Part 1: Data Flow – Bringing Data In and Sending it Out
- Part 2: Streamline Workflows with Enterprise Integrations
- Part 3: Customize to Meet Your Unique Needs
- Part 4: Save Time on Advanced Analytics Projects

Commenting is not enabled for this article.