What a year! In 2022, the ArcGIS Maps SDK for JavaScript (previously known as the ArcGIS API for JavaScript) underwent a name change, had three successful releases, and brought you lots of exciting new features, bug fixes, and enhancements!
Here’s a quick look at the year by the numbers:
- 30 new samples added
- 130 new classes added
- 58 support bugs fixed
- 14 support enhancements implemented
Now let’s take a look at the key highlights from this past year.
Editing
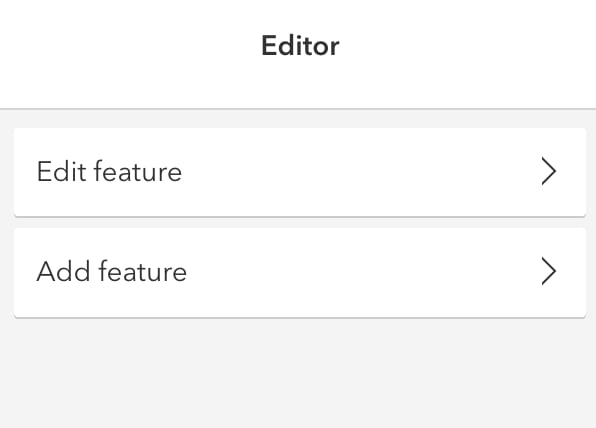
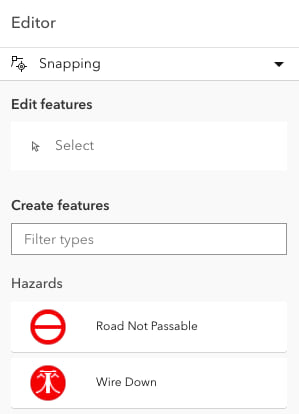
A significant amount of work was put into improving the editing experience this year — you’ll notice this work right away in the new and improved Editor widget. The Editor now supports selection and snapping for improved feature manipulation and placement.
| Editor widget | |
|---|---|
| Version 4.22 | Version 4.25 |
 |
 |
In the FeatureForm, we’ve added support for contingent attribute values, allowing you to calculate the value of a field based on the data value of a different field. Taking that one step further, we introduced the ability to access data from other layers through FeatureSets in version 4.25.
Visualization
We also spent a lot of time this year working on many exciting visualization capabilities – such as new ways to aggregate your data with binning and custom cluster styles, along with some new and improved renderers. Let’s take a closer look at these enhancements.
Aggregation
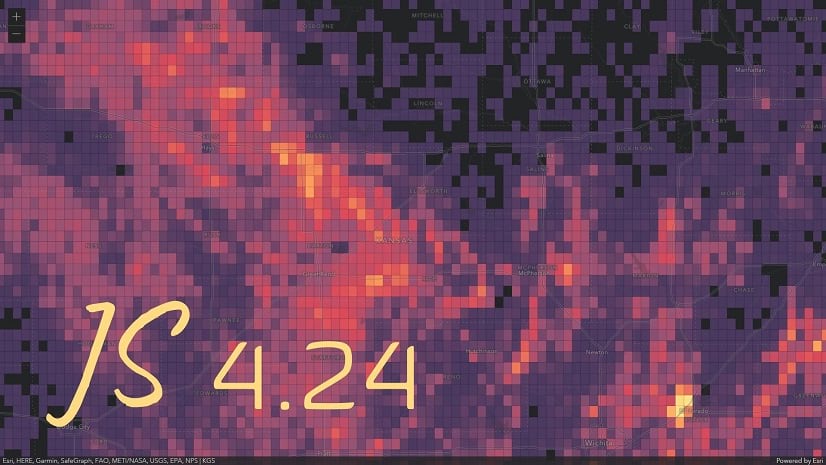
At version 4.24, we introduced client-side binning as a new feature reduction method in 2D MapViews. Binning visualizations aggregate point data client-side by geohash cells based on a provided level of detail. To learn more about this new feature, check out the following blog post: Binning now available in the ArcGIS API for JavaScript.

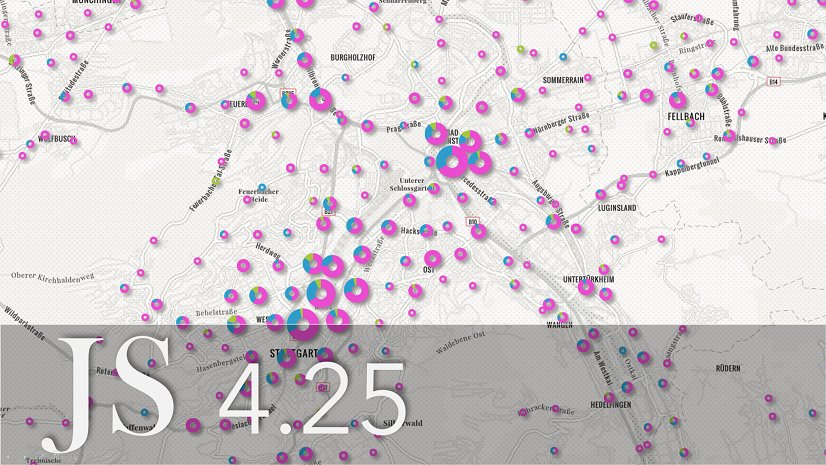
More recently at version 4.25, we introduced the ability to override the default style of point clusters with either a dedicated cluster symbol or renderer. Learn more about all the different ways you can style your clusters in 8 ways to style point clusters on the web.

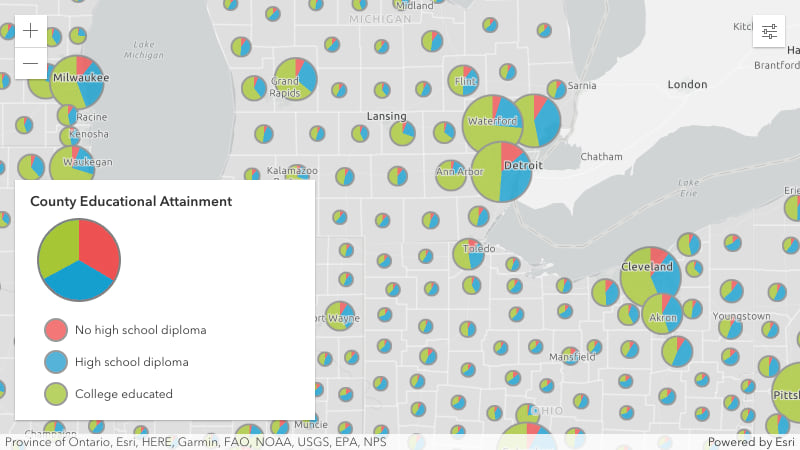
Pie charts style
You can now use pie charts to visualize multiple attribute values of a feature in a point or polygon layer at once with the new PieChartRenderer in 2D. The value of each pie slice can be determined by a field value or Arcade expression.
Improved Heatmap support
HeatmapRenderer now renders with WebGL, which means it can now take advantage of the following benefits:
- Improved performance with large datasets
- Improved responsiveness
- Support for Popups and programmatic hitTests
- Support for filtering and labeling with FeatureFilter and FeatureEffect in 2D MapViews
Check out Heat maps now render faster and smoother in the browser to learn more. In addition to all of this, Heatmaps are now supported in 3D! ?
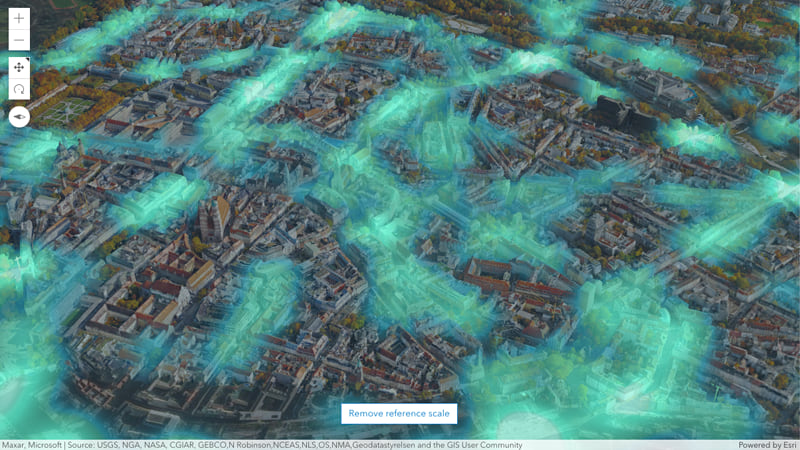
FlowRenderer
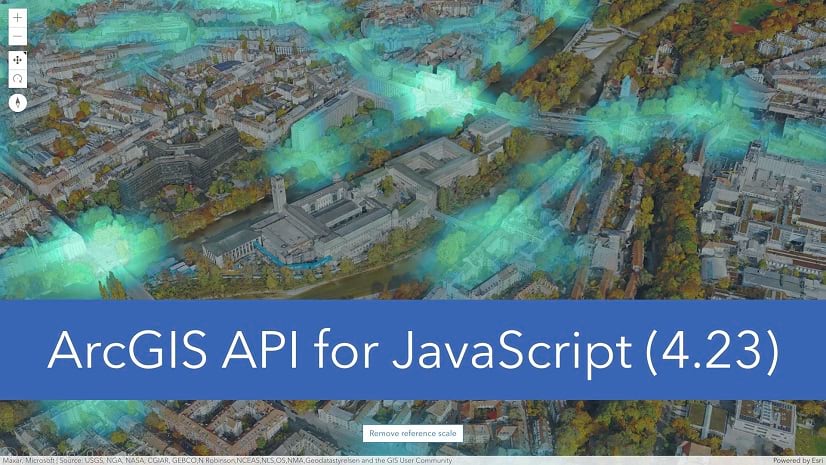
At version 4.23, we introduced the FlowRenderer, which brings a new way of rendering multidimensional raster data with animated streamlines. Learn more about this exciting new way to visualize magnitude and direction in your imagery layers at Create an animated flow visualization with the ArcGIS API for JavaScript.
Media Layer
Another big highlight this year was the introduction of MediaLayer. MediaLayer allows you to add static image and video elements to the map at a specified geographic location in 2D and 3D. Control points can be used to position, scale, rotate, or skew the image or video in the map.
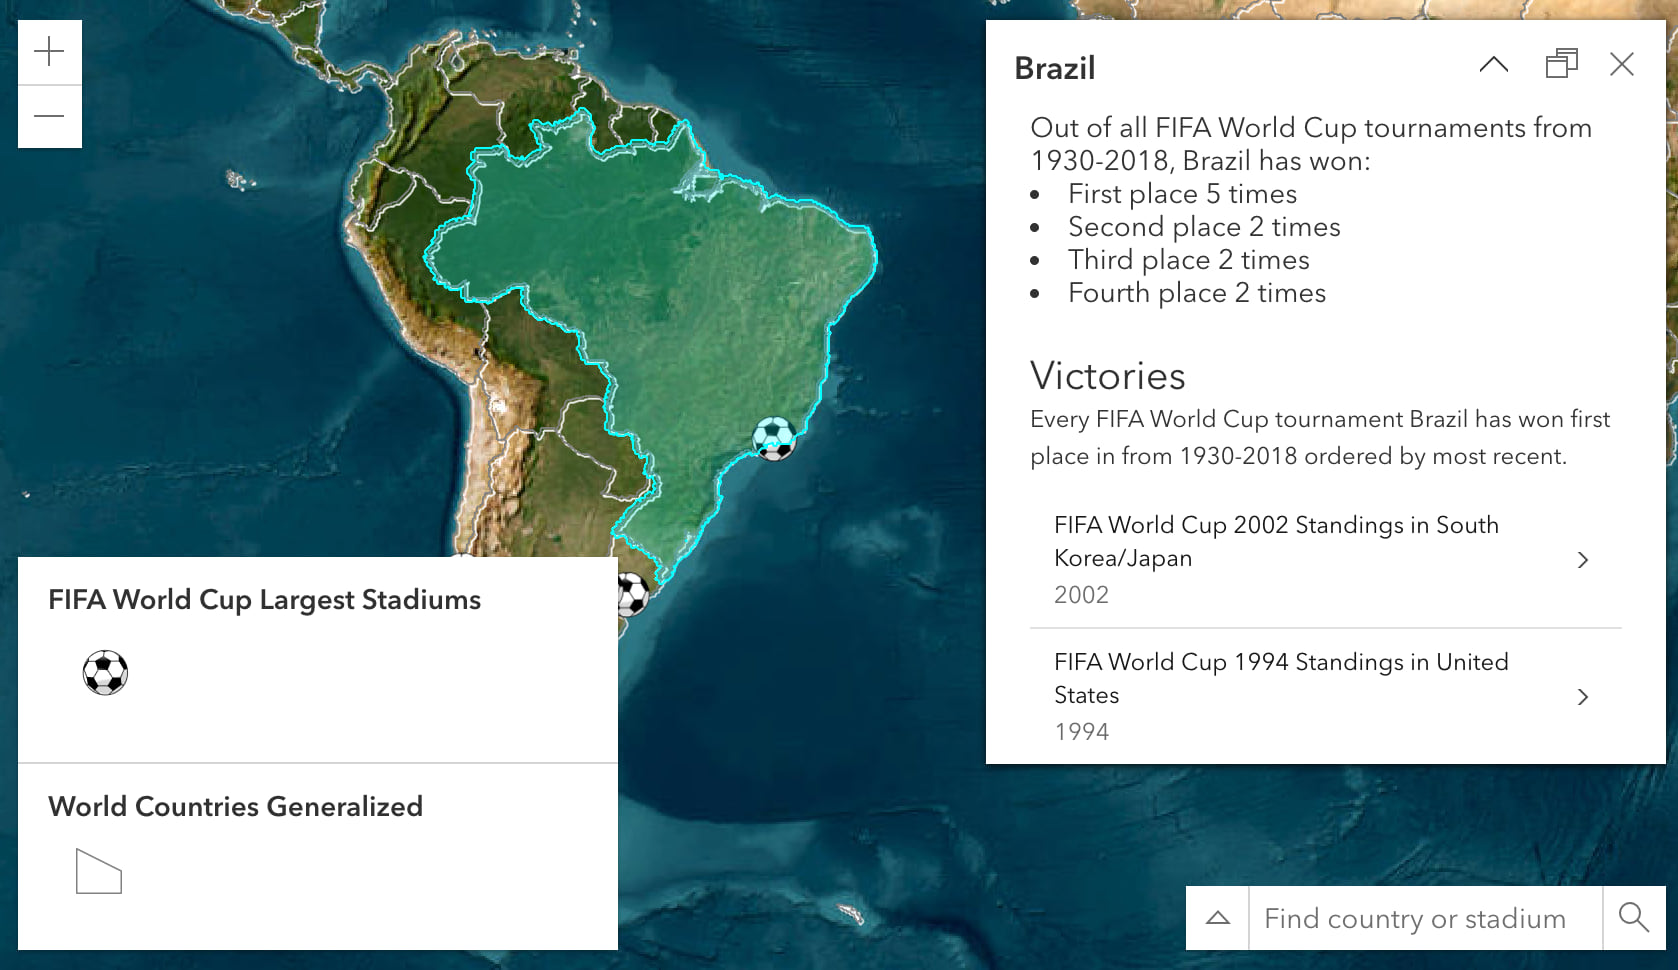
Related records in Popups
We’ve also added the long-awaited capability to display related records in Popups using the new RelationshipContent content type in PopupTemplate. When configuring RelationshipContent, the related layer or table must be added to the map. Learn all about this new feature in this blog post, Browsing Related Records in the ArcGIS API for JavaScript.
3D support
On the 3D side of things, we’ve made significant enhancements over the past year to improve your experience working with scenes.
- Weather widget – Bring your scene to life with realistic weather effects like rain, snow, or fog!
- Length dimensioning – Annotate objects in your scene with horizontal or vertical dimensions. Did you know that dimensions can be saved and shared in web scenes?
- Blend modes – Create new and aesthetically pleasing visualizations of the ground using blend modes in 3D. You can use the same blend modes already available in 2D to combine multiple tiled layers in your scene.
- Line style markers – Add markers to your line features to emphasize their starting and ending points, or arrows to indicate a direction.
- Label styles – Improve the appearance of labels and text in your scenes by using the new styling options on TextSymbol3DLayer.

- Voxel layer enhancements – Drill deeper into your voxel data using variables and client-side render capabilities. Learn more about all that’s possible with VoxelLayers in this blog post.
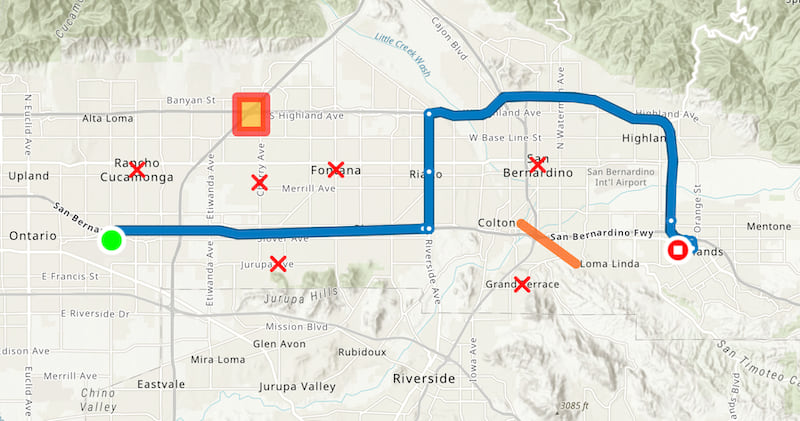
Route layer
In early 2022, we introduced RouteLayer, a new standalone layer for analyzing, visualizing and saving routes. Later in the year, we fully integrated RouteLayer into the Directions widget. Use Directions to open routes created by others or save new routes directly to ArcGIS Online. See Introducing the new RouteLayer to learn more.
reactiveUtils
We also introduced reactiveUtils this year to provide new utilities and convenience functions for watching properties. It offers significant enhancements over watchUtils, which is now deprecated. Enhancements include improved developer usability and type safety, (i.e. using optional chaining of object properties), as well as the ability to work directly with Collections and multiple properties.
// WatchUtils: watch for changes in the view's "updating" property,
//   ie. true/false
watchUtils.watch(view, "updating", (updating) => console.log(updating));

// ReactiveUtils: Does the same as above with slightly different syntax
reactiveUtils.watch(() => view.updating, (updating) => console.log(updating));
Other 2022 highlights
Besides adding all these new features to our API, here are some of the other great highlights from this year:
- We welcomed back in-person conferences! We loved seeing you all at the Developers Summit in Palm Springs and at the User Conference in San Diego. The 2023 Developer Summit will be held March 7-10th, and we hope to see you again this year. Registration is open now!
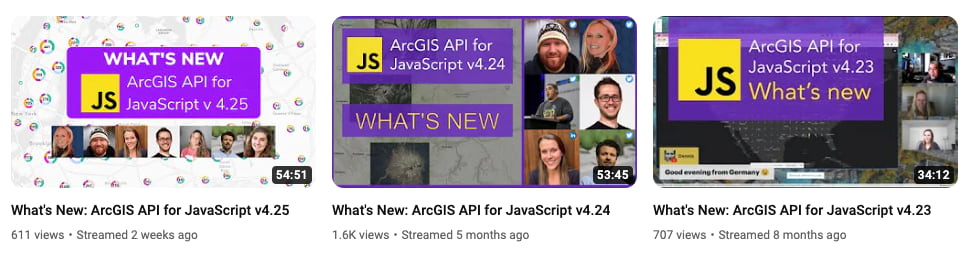
- We started hosting release livestreams to let you hear about the release directly from the product team. In case you missed them, each livestream recording can be found on the ArcGIS Developers YouTube channel.
Happy holidays!
Thanks for spending the year with us. This blog just provides an overview of the features added this past year. For more detailed information about each release this year, visit the release notes for 4.25, 4.24, and 4.23.
From all of us working on the ArcGIS Maps SDK for JavaScript, we hope you have a wonderful holiday season and a happy New Year! ✨


Article Discussion: