In the early morning hours of Sunday, October 3, residents in the surfing town of Huntington Beach, California noticed the smell of oil. Thoughts of a leak at a nearby gas station were quickly replaced by a nightmare scenario. The cause was a small, 13-inch gash in a 17.7-mile-long undersea pipeline that resulted in a noxious spill that spread along 15.7 miles of beaches in and around Surf City USA. Nearly 5,000 gallons of light crude oil have been recovered of an estimated 126,000 gallons that leaked as of October 5, 2021. The spill is still causing headaches, the beaches are closed, and the ecological damage is severe. The cleanup will take months.
This week serves as a stark reminder that the world we live in is challenged by threats and hazards of all types and sizes. And this kind of incident can occur at any time and at any location.
For those responding to an oil spill, or any incident for that matter, GIS is a tried and tested tool for action. Here at Esri, we look back at the 1994 Northridge Earthquake as the moment we realized how impactful the geographic approach can be during an emergency response. This incident serves as the foundation of what is today known as the Esri Disaster Response Program (DRP).
While GIS technology has greatly advanced over the last 27 years —and become far more agile and accessible thanks to Web GIS—the key GIS capabilities needed for an effective response have remained much the same. In fact, these same capabilities were on display during the 2010 Deepwater Horizon oil spill, and they continue to be validated today on all types and sizes of emergencies around the world.
This week the California Oil Spill serves as a reminder for all of us that preparedness is key. It is also a chance to reflect back to on the Deepwater Horizon oil spill and apply the GIS lessons learned. Here is a short playbook that can be used at any time to assess your GIS readiness – for an oil spill, a flood, a hurricane, a wildland fire, or any incident.
These are the three keys to applying GIS for disaster response:
Develop Real-time, Shared Situational Awareness
In the Deepwater Horizon incident, having a single shared understanding of the evolving crisis was key. Spill management teams, federal agencies, local governments, and volunteer organizations all needed a single source of truth, a common operating picture, for the latest information about the extent of the spill and the status of ongoing cleanup activities. GIS provided common base maps for marine navigation, details about environmentally sensitive areas, and a system to manage and share information into web based applications for better situational awareness.
With this shared understanding, decision makers across all partner agencies were able to make more informed decisions about how to evolve the response and recovery without duplicating efforts or creating additional complexity in the midst of an already intense situation.
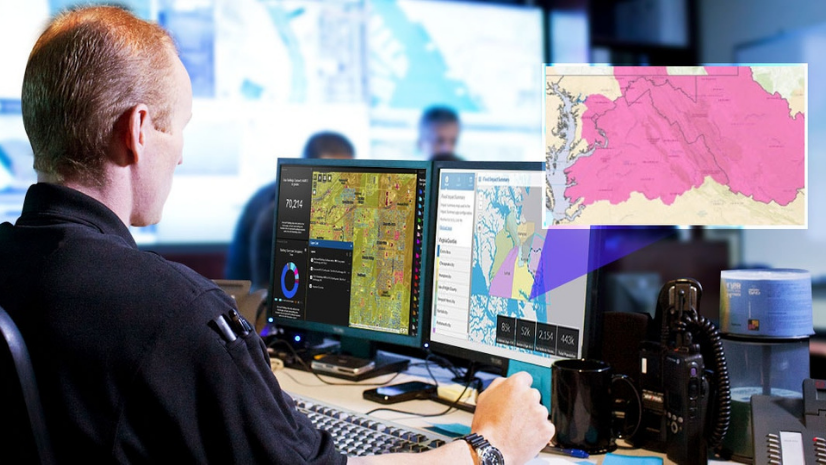
Building your common operating picture is the first step to ensuring your agency has the information it needs to make informed, mission-critical decisions during a response. ArcGIS Dashboards provide a configurable framework to deliver your common operating picture. As a common point of reference, ArcGIS Dashboards are the tool used to deliver the Johns Hopkins COVID-19 dashboard seen around the world.
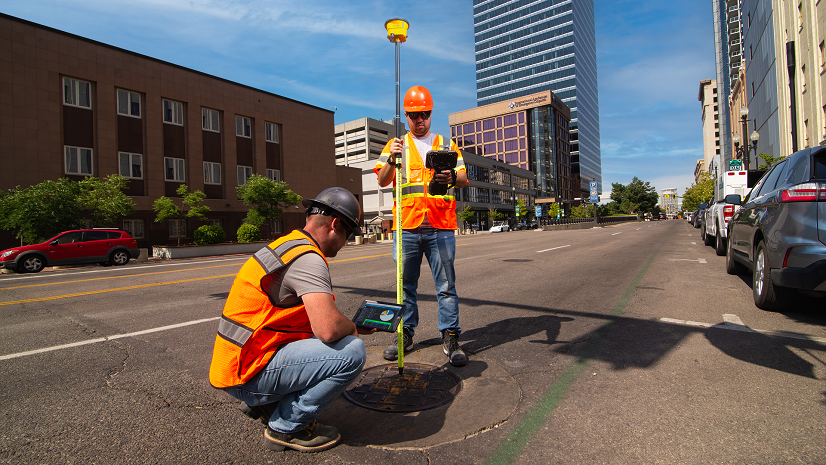
Connect with Mobile Field Teams
As field teams deploy in response to an incident, they provide critical inputs to fill in the details, and gaps, that help refine the overall response picture. Without their first-hand account from the field and the contextual data they collect, many operational decisions are put at risk.
During the Deepwater Horizon incident, David Gisclair, technical assistance program director at the Louisiana Oil Spill Coordinator’s Office said, “Since the spill is accruing over a large geographic area, various analysis techniques are being employed to verify placement of boom assets used to mitigate the effects of oil on the shoreline. By using GIS technology, field information can be processed into products that are useful in the incident command decision-making process.”
The field teams and volunteers, connected to the operations center using mobile apps for GIS data collection and tracking, proved invaluable for aiding in the accuracy of the response and recovery efforts. As you plan your next response, consider making mobile tools on of your first priorities.
ArcGIS Survey123 provides a form-centric data collection tool that will seem familiar to non-GIS professionals tasked with data collection using paper forms. There are ArcGIS Solutions for common mobile workflows like the FEMA Damage Assessment process or emergency debris management that you can quickly configure and deploy using Survey 123. There is also a ready-to-deploy field survey within Survey 123 included out of the box for NOAA’s Shoreline Cleanup and Assessment Template (SCAT) process that adheres to their short form.
For those who need a map-based application and data visualization on the incident, consider tools like ArcGIS Field Maps which also includes location tracking to follow and safeguard field personnel as they work the incident.
Communicate and Collaborate with Stakeholders and the Public
Worrying about the unknown due to a lack of information can be paralyzing; however having access to the right information at the right time can be life saving. That applies to the general public, who are looking for information about the response and recovery efforts, and responders who need open lines of communication to be effective. No one agency has all the answers – all partners are needed during a response.
A shared map provides a critical conduit for information sharing – delivering content along with the geographic context needed to make decisions. During the Deepwater Horizon incident, there were a multitude of partners with various missions, each with varying degrees of geographic knowledge. In addition, the news media and the public were looking to understand the impact on their local landscape. Using ArcGIS, these partners were able to connect together to share information securely with each other, and provide a single, authoritative map for the public that conveyed the ongoing status of the response.
ArcGIS Hub provides the tools to collaborate and engage with your community of responders, media, and the public. By sharing and collaborating using ArcGIS Online, you can ensure data is protected and shared securely among your response partners. For your public facing applications, you can leverage ArcGIS Online’s cloud scalability to ensure your apps perform well, even when they go viral.
To provide a starting point and an example organized around various hazards, the Esri DRP has created an open ArcGIS Hub site that will connect you with appropriate data, maps, and apps specific to each hazard type.
In the case of the California coastal oil spill, here is a direct link to the ArcGIS Hub site that is dedicated to helping organizations jump-start their geographic approach to the oil spill response. The spill is only an hour away from Esri headquarters here in Redlands, California, so this incident hits close to our hearts. The tried and true steps above have been helpful in managing incidents around the world, but this incident is a good reminder that bad things can happen on any day right in your own back yard.
I hope these three key steps will provide a roadmap to help you become better prepared. You can learn more about how GIS supports Emergency Management Operations, and read user case studies on the different capabilities for further inspiration, by downloading the Real-Time Emergency Management Operations eBook here.
To request urgent GIS support for your ongoing crisis response, visit https://www.esri.com/disaster.