Location data forms the foundation for all geospatial operations. With that truism in mind, Esri provides our users essential, ready-to-use location data to reveal patterns, relationships, and situations.
Data accuracy matters, and like all systems, inaccurate input yields inaccurate output. In this era of Big Data, with more data created than ever before, what often gets lost is the question of data quality. Esri’s effort to curate and create high-quality location data with a strong, well-documented, and traceable lineage yields authoritative data with increasing accuracy and completeness.
Esri invests in data curation and creation (along with partners) to complement the data that users create with GIS tools and workflows. Esri has an expert team of cartographers, geographers, and demographers that create high-quality data and geospatial information products that help GIS users make accurate and impactful maps and allow anyone to derive a better understanding of places, the people who live there, and their preferences.
Over decades, the Esri data strategy has evolved to encompass the creation and distribution of a broad range of global location data that spans all location data types, involves a broad diversity of data contributors, and includes a variety of data delivery mechanisms.
Bringing Data to Life
As technology has evolved, the flow of data has increased, and data integration and aggregation has become easier. Esri’s Web GIS architecture—delivered via desktop, enterprise, and software-as-a-service—uses web services to dynamically integrate, analyze, and make available geospatial data as services. Users access and add to the continuously updated data contained in ArcGIS Living Atlas of the World—a rich library of ready-to-use maps, apps, and data layers for the entire world. This data can be served as live streams to provide information and context in apps that are available anywhere, anytime, and on any device.
The broad and consistent inputs to Esri’s curated and created data helps mirror on-the-ground realities around the world, with up-to-date and live data fueling new levels of map-based communication.
Here are 10 ways that Esri helps users add spatial context to their work.
1. A Virtuous Cycle of Contributors
The GIS community is full of active participants that understand that the GIS they use and maintain is part of a much larger ecosystem that improves with every interaction. The quality and accuracy of everyone’s work benefits from collective data contributions.
The data that Esri creates often builds upon publicly available data from authoritative sources that is usually created using a GIS. Esri also benefits from the network of partners, distributors, and users who create and enhance location data. The curation and creation process continues in a cycle where many add input that fuels the next spin of increasing quality and accuracy that enhance mapping and insight.
The ArcGIS Marketplace offers useful apps and data services from partners that address specific data types, such as social media and point-of-interest data, and the requirements of specific industries, such as banking or real estate. When users start a new project, the Marketplace is often the first place they visit to gather the necessary data to tackle the problem at hand.
2. Basemaps

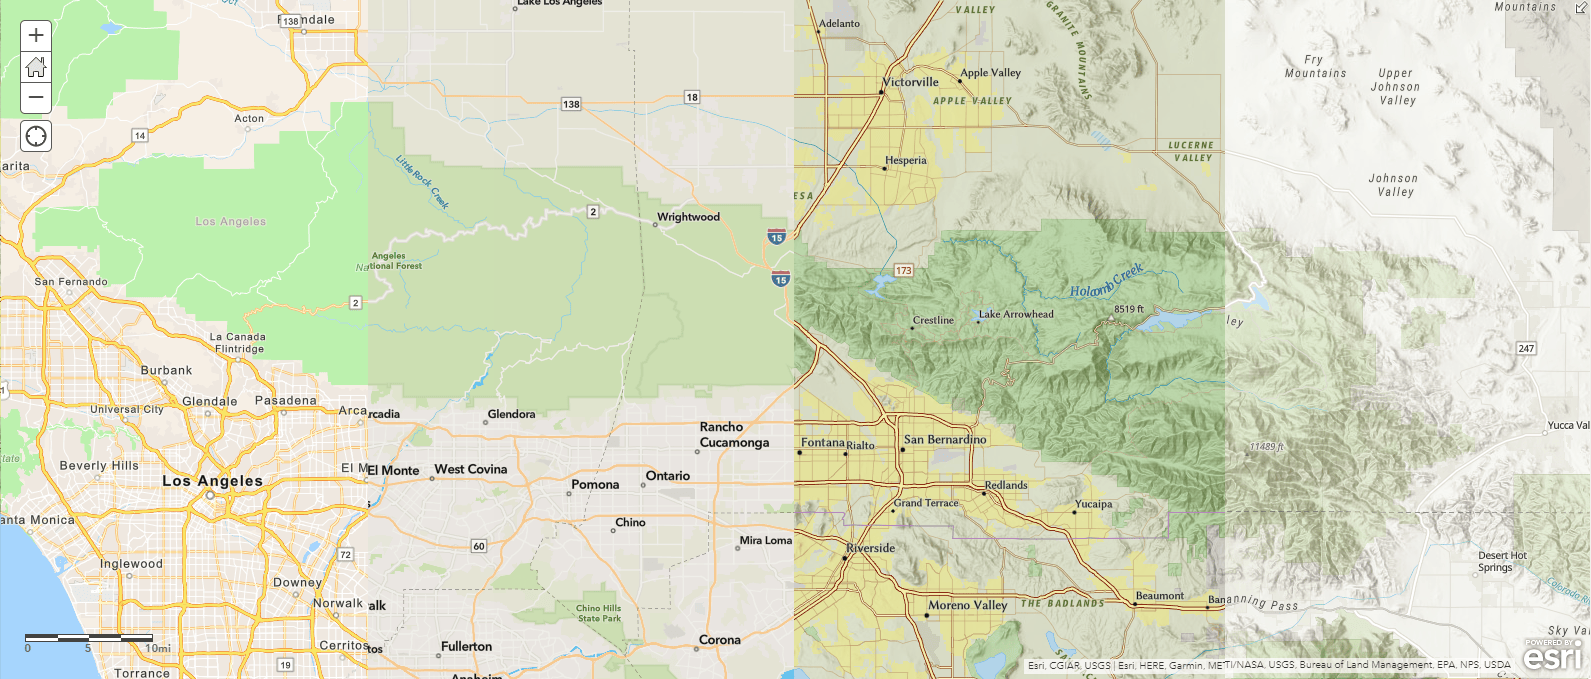
When a user creates a map, they have a choice of what basemap to use to give context to their content. Basemaps include details that reveal themselves at different zoom levels from the global scale down to the street level, and even a single building. Basemaps with global coverage are available in a variety of styles. Users can customize these styles to adjust labels, colors, and more to present engaging information products.
The global scale of Esri-built data includes localized inputs from a community of contributors, thanks to Esri’s relationships with partners, distributors, and GIS users around the world. Many users contribute data to the Community Maps Program—creating features, sharing data layers and services. Contributions such as roads, parks, building footprints, and landmarks help to enhance content and add value and usability to Esri’s online basemaps.
Additional Basemaps are provided for elevation data features using shaded relief to show the physical features of both the land and oceans of our world. The Oceans basemap shows the elevation of coastal regions and the ocean seafloor and is particularly useful to marine GIS professionals.
3. Imagery
Imagery offers a top-down photo-derived view from sensors aboard aircraft and satellites to produce easily recognizable location context. Esri curates high-resolution imagery for most of the world. The World Imagery basemap provides a starting point for users to incorporate imagery and remote sensing data feeds, with much more available, including premium imagery content available from Esri partners.
The persistence of imagery data allows users to explore the past and compare it to current conditions or to examine a sequence of events through time in the World Imagery Wayback App.
Imagery sources such as multispectral layers, digital elevation models, and digital orthophotos provide an analytical foundation for modeling and telling stories of change. Imagery streams combined with the automated workflows of machine learning, provide the means to extract features such as roads, rivers, lakes, fields, and building footprints across stacks of imagery. Monitoring with imagery provides a means to forecast and predict the future based on patterns of the past.
World Imagery Wayback App
Explore World Imagery Wayback App in your browser…
4. Environmental
True to the roots of the company’s origin as the Environmental Systems Research Institute, Esri provides a wealth of environmental data. This data includes details about fresh water, oceans, land cover, soils, habitat, species, and biodiversity. It also details the ever-changing information about weather, climate, air quality, and pollution. Together, this environmental data allows users to engage in natural resource management and gain a better understanding of human impacts on our natural world.
Derived data products, such as Landscape Layers and the Ecological Marine Units provide an accounting framework to assess environmental diversity and degradation as well as to help users formulate plans for environmental restoration.
Esri has taken the best available data from many public data sources to provide a collection of datasets ready for exploration in GIS for landscape analysis and land use. This data, together with content that displays change, allows users to explore climate change, looking at such things as changes in precipitation and rising temperatures on land and in oceans.
5. Demographics

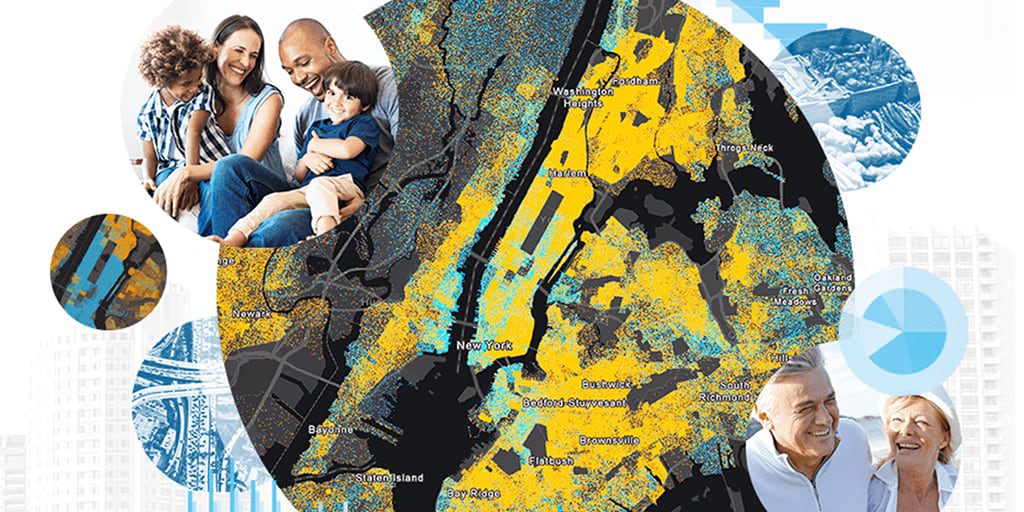
Esri hosts a global data portfolio of demographic data that includes thousands of data attributes for more than 130 countries. Demographic data is curated from authoritative data sources and is kept current with regular updates.
This data covers the basics, such as population, age, race, and gender, education, and marital status. It also taps into more sophisticated attributes of wealth and health, with data about jobs and home value and details on insurance.
Esri’s team of demographers curate and create current-year estimates and five-year projections of US demographics, including population, households, income, age, ethnicity, and more. With trusted data providers like the US Census Bureau and its American Community Survey, Michael Bauer Research and its Purchasing Power data, and Environics Analytics and its Canadian demographic data, the data about people and place has strong, traceable lineage.
Regular updates to demographics allow users to perform analysis on trends in age, diversity, housing affordability, and more. While the news media often reports broad national and regional shifts, those that use GIS can explore how these shifts impact locations and communities closest to your customers.
6. Business and Behavioral
Accurate and detailed descriptions of America’s changing population help businesses invest resources wisely by targeting locations and individuals where they will receive the most positive results.
Esri pulls together a variety of location data sources to help businesses understand customer preferences and behaviors based on lifestyle and spending habits. Consumer spending data details the products and services that US consumers are buying and where. Data is also curated about business locations, major shopping centers, and traffic volumes around retail sites. Together, this data helps retailers in their site selection and marketing efforts.
Esri’s Tapestry Segmentation data divides US residential neighborhoods into 67 distinct segments based on socioeconomic and demographic characteristics. LifeMode groups combine people with a shared experience, such as generational or immigrant status or a demographic trait, like affluence. Urbanization groups detail markets that provide distinct locales, like large cities or rural hamlets.
Tapestry ZIP Code lookup
Explore Tapestry ZIP Code Lookup in your browser…
7. Live Feeds
Esri offers a number of real-time data feeds related to weather conditions such as temperature, stream gauge readings, soil moisture, updates on weather watches, and warnings. Esri has a live traffic service that shows current traffic incidents and flow conditions.
Live data aids situational awareness and risk assessment for first responders and disaster managers as well as business leaders that require awareness in order to keep supply chains flowing.
Current Weather and Wind Station Data
Explore Current Weather and Wind Station Data in your browser.
8. Geocoding

Most data that organizations create and store have some element of location. Geocoding is the process of taking a description of a location—such as an address or a name of a place—and pinning that to a location on the Earth’s surface. Geocoding is a first step to turn tabular data into data that can be used to create web maps, apps, and story maps as well as conduct spatial analysis.
Users take data that contains an address or ZIP Code and run it individually or in batch through Esri’s World Geocoding service. Organizations geocode data to be explored in GIS with a variety of goals in mind, including improving the overall quality of data as part of their customer data management workflows, generating Location Based Services, or building spatially aware solutions.
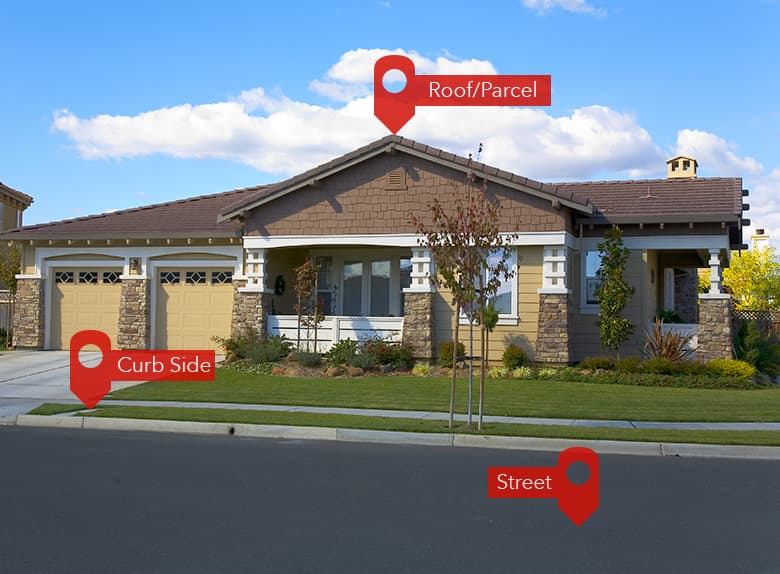
Esri’s geocoding solutions are delivered on-premises and in the cloud. Esri’s World Geocoding service has built-in intelligence that eliminates the need to normalize and standardize input addresses. The capabilities of Esri’s World Geocoding service have expanded over time to include functionality for local language support, geography-specific filtering, reverse geocoding, and the ability to use address input data of varying quality in order to return the highest-quality result. And, Esri geocoding offers options for both rooftop and curbside locations.
9. Network Services

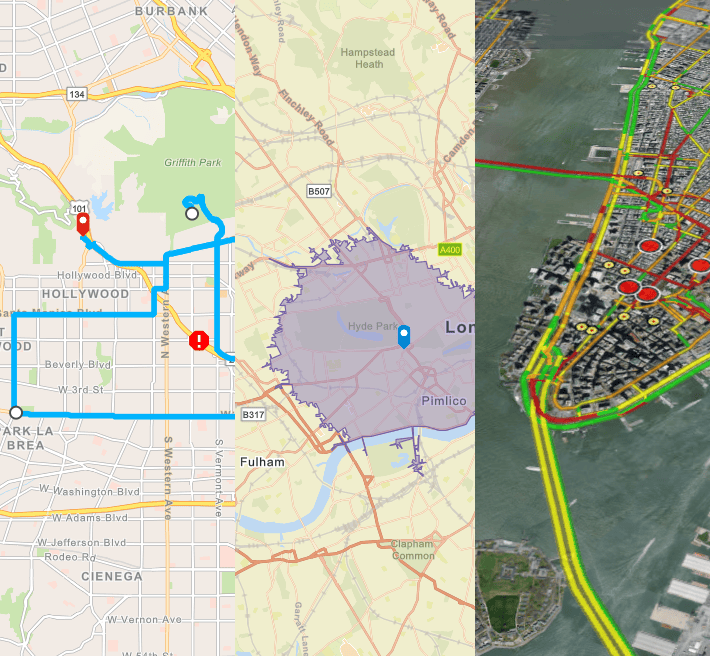
Once an organization’s data has been geocoded, services like Esri’s Routing and Network Analysis can bring it to life. The Routing Service has six key capabilities: generate routes between two or more locations, build service areas based on drive time to or from a location, find closest facilities, solve multi-vehicle routing problems, and solve complex business problems with location allocation and origin destination cost matrices.
The service is available in many countries around the world. Esri’s high-quality street data includes predictive and real-time traffic where available; road details about weight, width and height restrictions; and the ability for users to specify preferred truck routes or routes that avoid toll roads. Users of the fleet routing service can specify vehicle capacities, driver specialties, necessary work breaks, and time windows on orders. The routing service returns routes and delivers turn-by-turn directions in many languages and can be implemented in online or on-premises.
10. GeoEnrichment
Esri’s GeoEnrichment Service delivers details about the people, places, and preferences in a specific area or within a certain distance or drive time from a location. Users simply submit a point or polygon to the service to retrieve demographics and other relevant characteristics of the area. The GeoEnrichment Service returns details that maps alone can’t deliver.
Site analysis is a popular application for this service, returning profiles of the residential community, including lifestyle and buying habits, as well as a profile of other businesses in the area. Users deliver a study area to the service and receive a customizable data collection in return that is tuned to specific parameters.
Esri’s GeoEnrichment Service is the engine that powers several workflows in Esri products and it is also accessible to developers. The GeoEnrichment service automates the flow of key variables with simple data calls that developers can harness using Javascript and Python to create impactful apps.
GIS users are a passionate group with a unique perspective on the challenges for our people and planet. Together, we develop the geospatial data and higher-level information products needed to increase the value and insights that are derived from the tools. Get started…


Commenting is not enabled for this article.